

The Power Behind Vacancy Rates in Real Estate
Calculating vacancy rates is more than just a number; it's a fundamental aspect of smart real estate decisions. This key metric acts as a vital indicator of a property investment's health and potential. Understanding vacancy rate calculations empowers both property managers and investors to assess market trends, evaluate property performance, and make strategic choices to get the most out of their investments.
Why Vacancy Rates Matter
The vacancy rate reveals the equilibrium between supply and demand within a specific market. A high vacancy rate can indicate a slow market, possibly due to economic factors, an oversupply of properties, or decreased interest in a particular location. On the other hand, a low vacancy rate typically suggests a strong market with high demand, which can drive up rental prices.
For example, a high vacancy rate might be expected in a newly developing area undergoing rapid construction. However, the same rate in an established neighborhood would be a cause for concern. This highlights the importance of understanding the context surrounding the numbers for a precise interpretation.
This metric is especially important for property managers who are responsible for maximizing occupancy and rental income. By regularly monitoring vacancy rates, property managers can spot developing trends and take proactive steps to minimize vacant periods and maintain a positive cash flow. Investors also rely on vacancy rates to assess the profitability and potential of future investments. A property with consistently high vacancy rates could represent a risky investment, while a property with low and stable vacancy rates may indicate a more secure and profitable opportunity.
Vacancy rate calculation is crucial in commercial real estate to determine the percentage of unoccupied space. For instance, the U.S. office market saw a vacancy rate of approximately 21% in Q1 2025. This reveals that over one-fifth of office space was vacant, with cities like San Francisco experiencing even higher rates at 22.65%. Commercial Real Estate Statistics offer further details on this trend.
This metric is calculated by dividing the total vacant space by the total rentable space and multiplying by 100. A building with 1,000,000 square feet of rentable space and 210,000 square feet vacant, for example, has a vacancy rate of 21%. Monitoring this percentage allows stakeholders to understand market dynamics and overall economic health. The office sector, in particular, has seen challenges, with vacancy rate increases coinciding with value declines of 14% in the past year.
Impact of Vacancy Rates on Decision-Making
Changes in vacancy rates influence key decisions across the real estate lifecycle. These decisions can range from setting rental prices and offering concessions to planning property upgrades and evaluating investment opportunities. A rising vacancy rate may prompt property managers to adjust pricing strategies, ramp up marketing efforts, or offer incentives to attract new tenants.
Conversely, a consistently low vacancy rate could present an opportunity to raise rental rates or invest in improvements to increase property value and attract tenants willing to pay higher rents. In short, understanding the implications of vacancy rates allows for more effective property management and more profitable outcomes.
Calculate Vacancy Rate: The Formula That Never Fails
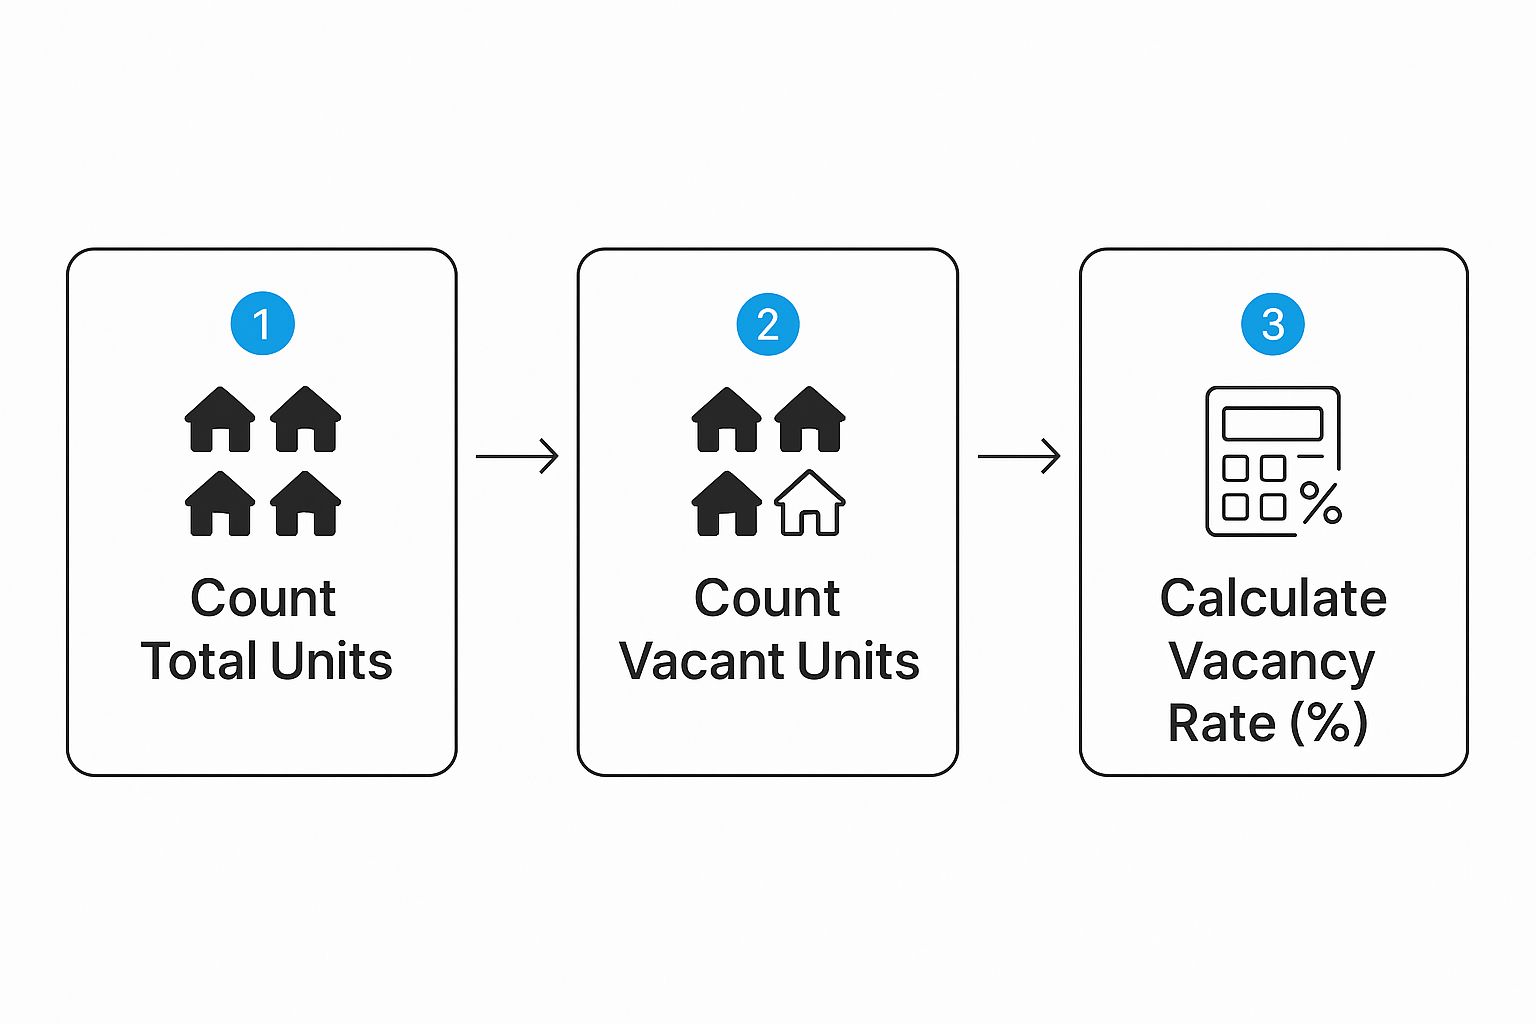
This infographic breaks down the vacancy rate calculation into three simple steps: assessing total units, identifying vacant units, and calculating the percentage. Understanding this process provides valuable insights for effective property management.
Understanding the Vacancy Rate Formula
The vacancy rate is a key performance indicator (KPI) for rental properties. It represents the percentage of unoccupied units out of the total number of units available. This metric informs critical decisions about rental pricing, income projections, and property upgrades.
The formula is straightforward:
(Number of Vacant Units / Total Number of Units) * 100 = Vacancy Rate (%)
Let's say you own a building with 50 units, and 5 are vacant. Your vacancy rate would be (5/50) * 100 = 10%. Even a seemingly small percentage like this can significantly impact your overall revenue.
Defining "Vacant"
While the formula itself is simple, defining a "vacant" unit requires careful consideration. Generally, a unit is vacant if it's empty and ready to rent. However, certain situations require further clarification.
- Units Under Renovation: Units being renovated should be considered vacant, even if not ready for tenants. They aren't generating income and are effectively unavailable.
- Recently Vacated Units: Units recently vacated but not yet cleaned or prepared for new tenants should also count as vacant.
- Notice Periods: Consider your lease terms. While a tenant giving notice is still technically occupying the unit until their lease ends, tracking upcoming vacancies separately is essential for accurate forecasting.
Practical Applications of the Vacancy Rate
Regularly calculating your vacancy rate offers several benefits:
- Track Performance: Monitor trends to identify potential issues and adjust strategies. Consistent tracking helps address small problems before they escalate.
- Benchmark Against Competitors: Comparing your rate to similar properties in your area helps assess your performance and pinpoint areas for improvement. This analysis can be a powerful tool for refining pricing strategies.
- Inform Investment Decisions: Vacancy rates are a critical factor in evaluating a property’s profitability. A consistently high rate might indicate issues with the property or its location.
- Optimize Pricing: Adjust rents based on vacancy trends. High rates might necessitate lowering rents to attract tenants, while low rates could justify increases.
To further illustrate the vacancy rate calculation across various property types, let's examine a few examples:
"Vacancy Rate Calculation Examples Across Property Types""This table provides calculation examples for different property types showing how to apply the vacancy rate formula in various real estate contexts"
This table demonstrates the consistent application of the vacancy rate formula regardless of property type. Whether dealing with apartment units, square footage of retail space, or single-family homes, the calculation remains the same.
By understanding the vacancy rate formula and its practical implications, you can make informed decisions that drive the success of your real estate investments. Accurate tracking empowers you to stay ahead of market trends and maximize your returns.
What Your Vacancy Rate Really Means: Sector by Sector

A 5% vacancy rate might be excellent news for one property owner but spell trouble for another. Why the difference? It all comes down to understanding the nuances of vacancy rates within specific property sectors. Comparing your rate to a general average can be misleading. Instead, focus on benchmarks within your property's specific category.
Residential Vacancy Rates
Residential properties, like single-family homes and apartment buildings, typically strive for low vacancy. A 3% to 5% vacancy rate is generally considered healthy. This range indicates steady housing demand.
However, local economic conditions and seasonal changes can impact these numbers. For example, a college town might see higher vacancy during summer break.
Office Vacancy Rates
The office sector is more complex. National averages can be deceiving, as office vacancy rates are highly influenced by local market conditions. Some major cities, like San Francisco, have seen rates above 22%, while other areas remain much lower. This highlights the importance of local market analysis. CommercialEdge provides detailed data on national office vacancies in their April 2025 report: The April 2025 office market report from CommercialEdge.
Retail Vacancy Rates
Retail vacancy rates are affected by consumer spending and the growth of e-commerce. Prime retail spots in thriving urban areas often have lower vacancy. Struggling malls and less desirable locations may experience much higher vacancy. Adapting to changing consumer preferences is vital for retail property managers.
Industrial Vacancy Rates
Industrial real estate vacancy rates fluctuate with supply and demand. Data from early 2025 reveals a national increase from 1.7% to 6.4%. This jump indicates increased available space as demand stabilizes after pandemic-related surges. The industry recorded a 7% vacancy rate in Q1 2025, up 30 basis points from previous quarters.
This signifies a return to pre-pandemic norms, characterized by more moderate demand. The vacancy rate is calculated as vacant space divided by total inventory. For instance, a 7% vacancy rate means that 3.5 million square feet are unleased out of 50 million total square feet: (3.5 million / 50 million) × 100 = 7%. Despite the rising vacancy, rent growth remains stable at 4.7% year-over-year, with robust development in cities like Phoenix (22.4 million square feet). These market shifts reflect a balancing act between high supply and moderate demand. More statistics can be found here: Industrial Market Returns to Pre-Pandemic Norms With Rising Vacancy Rates.
Hospitality Vacancy Rates
Hotels and other hospitality properties function differently. Vacancy is a normal part of their business cycle. Seasonal changes, travel trends, and local events influence occupancy. Analyzing hospitality vacancy rates requires understanding the specific market and demand factors.
Resort towns, for example, may have high vacancy during the off-season. Business hotels in major cities might see lower vacancy during the week. Analyzing these patterns helps hospitality managers optimize pricing and revenue.
Beyond Basic Math: Advanced Vacancy Metrics That Matter
While the basic vacancy rate calculation is essential, sophisticated property managers and investors dig deeper. Understanding advanced metrics provides a more nuanced view of property performance and market dynamics. This allows for more informed, strategic decision-making.
Physical Vacancy vs. Economic Vacancy
The physical vacancy rate, as we've discussed, is a simple measure of empty units. However, economic vacancy paints a more complete picture of a property's financial health. It considers not only empty units but also the impact of concessions, such as free rent or discounted rates, and lost potential income from units rented below market value. This distinction is crucial because a property might appear fully occupied with a low physical vacancy, but substantial concessions could significantly impact its actual income.
Imagine two identical apartment buildings, each with 100 units. Building A has a 5% physical vacancy rate, but no concessions are offered. Building B is 100% physically occupied, but 20% of tenants received one month of free rent. Building B has a higher economic vacancy, despite its lower physical vacancy. Confusing these metrics can lead to misjudgments about a property's financial performance.
Absorption Rate and Vacancy Duration
Beyond simple occupancy, the absorption rate measures how quickly vacant space is being filled in a specific market. This metric helps predict future vacancy trends and assess market strength. A high absorption rate suggests strong demand, while a low rate can indicate weakening market conditions.
Vacancy duration, the length of time a unit remains vacant, provides further insight. Prolonged vacancies can signal issues with the property itself, its pricing, or its marketing strategy. Tracking vacancy duration is particularly useful for property managers identifying problem units and optimizing their leasing processes.
Weighted Vacancy Rate
The weighted vacancy rate accounts for differences in unit size or revenue potential. This advanced calculation provides a more precise evaluation of a property's income-generating capacity. For instance, a large retail space remaining vacant has a greater financial impact than a small office unit being unoccupied. Weighted vacancy calculations assign different weights to units based on their size or potential revenue, providing a more accurate view of potential income loss.
Imagine a mixed-use property with retail spaces and small office suites. Calculating a weighted vacancy rate that assigns higher weights to the larger retail spaces would accurately reflect their greater impact on overall revenue. This can be invaluable for portfolio managers analyzing multi-property investments with varying unit sizes and income streams.
To illustrate the differences between these metrics, let's examine the following table:
"Comparison of Basic vs. Advanced Vacancy Metrics""This table contrasts standard vacancy rate calculations with more sophisticated metrics, showing when and how to use each for deeper property analysis"
As shown in the table, each metric offers unique insights. While the basic vacancy rate provides a starting point, the advanced metrics offer a more granular understanding of property performance.
These advanced metrics are critical for informed decision-making in the real estate market, allowing for a deeper understanding of property performance and market dynamics beyond the basic vacancy rate. By using these tools, property managers and investors can optimize their strategies and maximize their investment returns.
Location, Location, Calculation: Regional Vacancy Factors

Understanding how to calculate vacancy rate is crucial. However, recognizing that "normal" vacancy rates can shift significantly based on location is equally important. This isn't just about comparing cities. Even neighborhoods within the same city can see very different vacancy trends. What causes these variations? This section explores how regional factors reshape the idea of a "healthy" vacancy rate.
The Impact of Supply and Demand
One of the most important regional factors is the interplay of supply and demand. In areas with high demand and limited housing, vacancy rates are typically lower. Think of popular coastal towns or desirable city centers. Competition for units is fierce in these areas, driving down vacancy and often pushing up rental prices.
Conversely, locations with ample housing and lower demand may have higher vacancy rates, even with more affordable rents. This difference doesn't necessarily mean one location is "better." It simply shows how local supply and demand impact vacancy rate calculations.
For example, a thriving urban center with limited new construction might have a vacancy rate of 2%. A suburban area with ongoing development projects might have a rate closer to 8%. This becomes even more critical in highly sought-after Central Business Districts. Explore this topic further: Global Real Estate Outlook.
The Influence of Local Economies
Regional economic conditions also play a key role in shaping vacancy rates. A strong local economy with job growth and high incomes usually means lower vacancy rates. People move to the area for work, increasing housing demand.
On the other hand, areas experiencing job losses or economic downturns may see vacancy rates climb. This happens as people move away or can't afford current rents. Consider two neighboring towns. One has a booming tech industry attracting new residents, while the other relies on a declining manufacturing sector. The first town will likely have a much lower vacancy rate than the second, reflecting their different economic realities.
Recognizing the Warning Signs
Understanding regional factors helps property managers and investors spot early warnings of supply-demand imbalances. A sudden vacancy spike in a previously stable market could signal emerging economic problems or an oversupply of similar properties.
Conversely, consistently low vacancy rates could suggest a good investment opportunity, especially if paired with projected economic growth. Seasoned investors carefully analyze regional trends and adjust their strategies. They know a one-size-fits-all approach to vacancy rate analysis won't work. They tailor their decisions based on the specific dynamics of each market. For example, they might accept a slightly higher vacancy rate in a rapidly growing market with long-term potential.
Comparing Apples to Oranges
Finally, remember that comparing vacancy data across different geographical markets requires careful thought. A 5% vacancy rate in a bustling metropolis might be considered high, while the same rate in a rural town could be perfectly normal. Avoid simply comparing raw numbers.
Instead, analyze vacancy trends in relation to local economic indicators, population growth, and new construction activity. By understanding the complex interplay of regional factors, you gain a deeper understanding of a "normal" vacancy rate. This allows for better decision-making, whether you manage a single property or a large portfolio.
Supply constraints, especially in central business districts, significantly influence these rates. European markets, for instance, show extremely low vacancy rates in major cities like Paris (2.8%) and London (1.5% as of late 2024). This intense competition for prime real estate is driven by limited new construction, forecast to decline significantly in both the U.S. and Europe in 2025. Discover more insights about global real estate trends here. This reinforces how supply dynamics impact vacancy rate calculations and a market's capacity to absorb new supply.
Turning Vacancy Numbers Into Strategic Decisions
Calculating your vacancy rate is just the first step. The real power lies in using this data to inform strategic decisions that boost your bottom line. This means moving beyond simply acknowledging the numbers and actively using them to refine your property management approach. This section explores how successful property professionals translate vacancy metrics into actionable strategies.
Adjusting Rental Rates and Concessions
Savvy property managers use vacancy rate trends to fine-tune their pricing strategies. A rising vacancy rate often signals the need for adjustments. This could involve lowering rents to attract new tenants or offering concessions like free rent or reduced security deposits.
However, a consistently low vacancy rate presents an opportunity to raise rents, maximizing your income potential. For example, if your vacancy rate drops below 3% in a competitive market, it might be time to consider a rent increase. This dynamic pricing approach helps optimize revenue based on current market conditions.
Timing Renovations Strategically
Renovations are essential for maintaining property value, but their timing significantly impacts revenue. High vacancy periods are ideal for major upgrades, minimizing disruption to current tenants and lost rental income.
Conversely, undertaking significant renovations during periods of low vacancy can lead to lost revenue and tenant dissatisfaction. Strategic planning based on vacancy rates helps maximize the return on renovation investments while minimizing disruptions.
Setting Appropriate Vacancy Targets
While aiming for 0% vacancy might seem ideal, a small amount of vacancy can be beneficial. It allows flexibility in accommodating new tenants and avoids rushing into placing potentially problematic renters.
Setting realistic vacancy targets is essential. These targets should balance maximizing occupancy with maintaining tenant quality. When turning vacancy numbers into strategic decisions, consider how B2B marketing strategies can inform your approach. These strategies can offer valuable insights into attracting and retaining high-quality tenants.
Using Vacancy Trends for Investment Decisions
Sophisticated investors use vacancy rate trends beyond individual properties. They analyze broader market patterns for portfolio management and investment decisions. Rising vacancy rates in a specific area might signal a cooling market, prompting investors to reconsider new acquisitions in that location.
Conversely, low vacancy rates combined with strong economic indicators can identify promising investment opportunities. Vacancy trends are particularly valuable for acquisition due diligence, allowing investors to evaluate a property’s potential within the broader market context.
Decision Frameworks for Action
Connecting vacancy calculations to concrete business actions is crucial. This involves developing clear decision frameworks. For example:
- If vacancy rate > X%: Implement a marketing campaign, offer concessions, or re-evaluate rental rates.
- If vacancy rate < Y%: Consider rent increases, focus on tenant retention, or explore property upgrades to attract higher-paying tenants.
- If vacancy duration > Z months: Investigate the reasons for prolonged vacancy, such as property condition, pricing, or market competition.
These frameworks provide a structured approach to responding to vacancy trends and proactively managing your properties. By turning vacancy numbers into strategic decisions, you transform a simple metric into a powerful tool for optimizing profitability and managing risk across market cycles.
Ready to streamline your leasing process and minimize vacancy times? Discover how Showdigs, the AI-backed leasing automation platform, can transform your rental operations. Visit Showdigs today to learn more.