

Understanding What Vacant Properties Are Really Costing You
When a property sits empty, it's easy to focus on the most obvious loss: the monthly rent check that never arrives. Many property managers and landlords stop their math right there, treating vacancy as just a simple gap in income. But the true financial drain of an unoccupied property goes much deeper, creating a ripple effect that erodes your bottom line in ways you won't see on a bank statement. This is where a cost of vacancy calculator becomes more than just a tool; it becomes a lens for seeing the full picture.
The costs you don't see are often the most damaging. These are the silent cash flow killers that pile up each day a unit remains empty. Back-of-the-napkin math almost always falls short because it ignores these critical, hidden expenses.
Beyond Lost Rent: The Hidden Financial Leaks
Think about the expenses that keep hitting your account regardless of whether a tenant is there or not. You're still on the hook for these, and without rental income to offset them, they come directly out of your pocket. These often include:
- Utilities: Even in an empty unit, you’ll likely have to pay for baseline electricity, water, and gas to prevent issues like frozen pipes or to accommodate showings.
- Property Taxes and Insurance: These are fixed costs that don’t pause just because your property is vacant.
- Maintenance and Landscaping: Lawns still need mowing, and common areas require upkeep to maintain curb appeal for prospective tenants.
- Security: An empty property can be a magnet for vandalism and theft, potentially requiring extra security measures. To learn more about protecting your asset, check out our guide on the risks of unoccupied vacant properties.
These ongoing expenses are just the beginning. The real challenge comes from the larger market forces at play. For instance, the commercial sector has seen a major shift. The U.S. office vacancy rate soared to 19.2% by early 2025, a huge jump of 7.3 percentage points since 2020. For a standard 200,000-square-foot office building, a mere 5% vacancy can translate to over $333,000 in lost rent annually—and that's before factoring in marketing and upkeep. This trend shows why precise calculations are no longer optional.
The True Opportunity Cost of an Empty Unit
The final, and perhaps most significant, hidden expense is opportunity cost. Every day your property is vacant is a day you're not just losing money—you're losing the potential for that money to grow. That lost rent could have been used to pay down a mortgage, invest in another property, or fund capital improvements that boost future rental value. This lost potential is a powerful reason to use a cost of vacancy calculator, helping you shorten vacancy periods and get your investment working for you again.
Gathering the Right Data for Accurate Calculations
A cost of vacancy calculator is only as smart as the numbers you feed it. The old saying "garbage in, garbage out" is especially true here—using vague estimates or outdated figures will give you a misleading result that could lead to poor financial decisions. To get a truly accurate picture of your losses, you need to systematically collect specific, real-world data points from your portfolio.
This goes way beyond just knowing the monthly rent. The most successful property owners I know track a mix of direct and indirect costs to make sure their calculations are both complete and useful.
Essential Data Points to Track
Before you can crunch any numbers, you need to gather the right inputs. Some of these are obvious, but others are often overlooked and just as important for getting the full picture.
- Direct Lost Rent: This one is the most straightforward—it's the potential monthly rental income for the empty property. Make sure you use the current market rate, not what the last tenant was paying.
- Carrying Costs: Think of these as the non-negotiable expenses you're stuck with whether the unit is occupied or not. This includes property taxes, insurance, HOA fees, and baseline utilities like electricity and water needed for showings and maintenance.
- Turnover and Marketing Expenses: These are all the costs that pop up when you're preparing the unit and finding a new tenant. For property managers and real estate professionals, tracking these expenses with precision is a must. To get exact figures, you might use specialized invoice management solutions tailored for real estate to keep all that data organized.
- Vacancy Duration: This is a big one. You need to know the exact number of days the property sits empty, from the moment the old tenant moves out to the day the new one signs the lease and moves in.
Avoiding Common Data Gaps
A lot of landlords fall into the trap of using company-wide averages or old data. For example, the cost to turn a single-family home in a quiet suburb will be completely different from turning a downtown apartment. Your data has to be specific to the property type and its local market.
Another common mistake is failing to account for seasonal variations. A property that becomes vacant in December will almost certainly have a longer vacancy period and maybe even higher marketing costs than one that opens up in June. Tracking this historical data lets you build much more realistic forecasts.
Ignoring these details is the number one reason calculations are off base. The goal is to move from broad statistics to a precise, property-specific financial model that tells you exactly what each day of vacancy is costing you. This detailed approach is what changes your cost of vacancy calculator from a simple guess into a powerful tool for making smart decisions.
The Complete Cost of Vacancy Formula That Actually Works
Moving beyond guesswork requires a formula that captures every dollar slipping through the cracks. A truly effective cost of vacancy calculator doesn't just subtract rent; it adds up all the direct and indirect expenses that pile up while your property sits empty. It’s a common mistake to use a simplified formula, which can make a $5,000 loss look like a $2,000 one, leading to poor decisions on pricing and marketing spend.
The formula that works in the real world is thorough. Think of it as:
Total Cost of Vacancy = (Daily Rent x Vacancy Days) + Turnover Costs + Carrying Costs
Let's break that down into practical terms so you can put it to use.
The Key Ingredients of Your Calculation
To make this formula actionable, you need to define each part with real numbers from your own operations. Experienced investors are meticulous about this because they know small inaccuracies compound into significant errors.
Here's what you need to track:
Daily Rent x Vacancy Days: This is your primary lost income. If your property rents for $2,100 a month, your daily rent is $70. A 30-day vacancy immediately costs you $2,100 in lost rent alone. This is the most obvious cost, but it's just the starting point.
Turnover Costs: These are the one-time expenses required to get the property ready for a new tenant. This bucket includes everything from fresh paint and minor repairs to professional cleaning, rekeying locks, and marketing fees for listing sites.
Carrying Costs: These are the relentless, ongoing expenses you can't escape. You still have to pay for property taxes, insurance, basic utilities (to keep the lights on for showings), and any HOA fees. These costs don't care if you have a tenant or not.
Before we dive deeper, it's helpful to see how these costs compare, especially between residential and commercial properties. The table below outlines the typical components and their financial weight.
This comparison shows that while lost rent is the biggest piece of the puzzle for both property types, ancillary costs like marketing and taxes can have a much larger proportional impact on commercial vacancies.
The following infographic illustrates how seemingly small daily losses can quickly add up, based on average rent and vacancy duration.
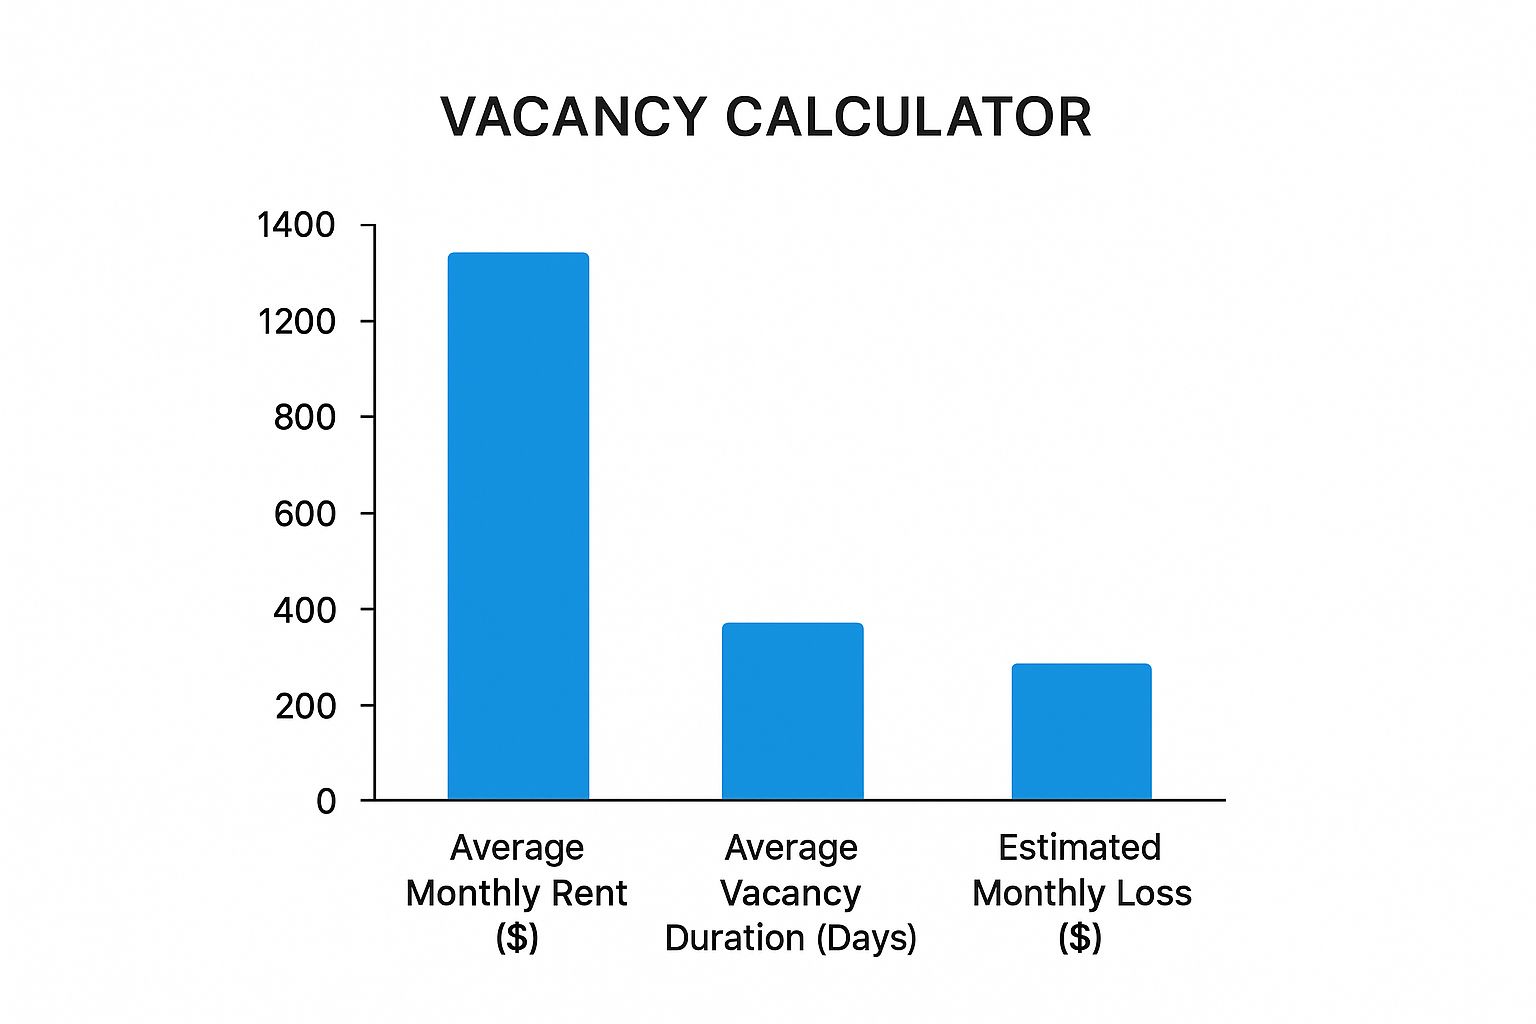
This visualization drives home the direct link between how long a unit is empty and your total financial loss, reinforcing why minimizing those empty days is so critical. Think about it this way: some studies on employee turnover suggest that a disengaged employee can cost a company 34% of their salary in lost productivity. The same principle applies here. An unmotivated or inefficient leasing process directly inflates your vacancy costs.
By using a complete cost of vacancy calculator, you’re not just tracking numbers; you’re building a clear financial case for investing in strategies that reduce vacancy time. This detailed approach provides the clarity needed to make confident, profitable decisions for your properties.
Real-World Scenarios: Seeing the Calculator in Action
The true power of a cost of vacancy calculator isn't in the abstract formula but in seeing it work with real numbers and situations. The financial sting of an empty property varies wildly depending on its type, location, and the market. Let’s move past theory and apply our calculations to a few distinct scenarios to see how these costs materialize.

Single-Family Home in a Competitive Suburb
Imagine a three-bedroom single-family home in a desirable suburban neighborhood. The market rent is $3,000 per month, which breaks down to $100 per day. The previous tenant left on the last day of the month, and it took 25 days to find and place a qualified new tenant.
Let's do the math on what that vacancy actually cost:
- Lost Rent: This is the most obvious hit. At $100 a day for 25 days, that's $2,500 right off the top.
- Turnover Costs: Getting the property ready for the next person isn't free. This includes professional cleaning ($400), minor paint touch-ups ($300), rekeying locks ($150), and marketing photos ($200). That’s a total of $1,050.
- Carrying Costs: The bills don't stop just because the unit is empty. For those 25 days, you still paid for utilities ($120), landscaping ($100), and a prorated portion of your annual property taxes and insurance (around $350). These add up to $570.
When you put it all together, the total cost isn't just the lost rent; it's a staggering $4,120. A common mistake is only budgeting for the lost rent, which would leave a $1,620 hole in your cash flow. This is exactly why savvy landlords use these calculations to justify accepting a slightly lower rent from a high-quality applicant who can move in immediately, potentially saving thousands in the long run.
Multi-Unit Building vs. Commercial Space
The dynamics change significantly with different property types. A vacant unit in a 20-unit apartment building feels different than an empty retail storefront. While the landlord of the apartment building is still collecting rent from 19 other units, the loss still stings and directly impacts the property's overall net operating income.
For commercial properties, the stakes are even higher. Retail owners, for example, have faced unique pressures. While overall retail vacancy was a relatively low 4.1% in 2025, malls specifically saw an 8.6% vacancy rate. For a large shopping center, even a small vacancy creates a huge financial gap. Consider this: a 5% vacancy on a 500,000-square-foot property with rents at $20 per square foot means $500,000 in annual lost rent. These aren't just numbers on a page; they represent a significant threat to the property's value and its ability to attract other tenants, contributing to declines in core commercial property values of up to 24%. You can explore more about these commercial real estate trends and their financial impact by reviewing the latest industry statistics and analysis.
These examples highlight a crucial lesson: the cost of vacancy is never just one number. It's a combination of direct losses, operational expenses, and market pressures. By meticulously using a cost of vacancy calculator, you can shift from reacting to losses to proactively managing your assets for better financial health.
Choosing the Right Digital Tools and Calculators
Knowing the formula behind vacancy costs is one thing, but using the right cost of vacancy calculator can completely change how you manage your properties. Sure, you can punch the numbers into a spreadsheet, but dedicated digital tools automate the process, offer deeper insights, and fit right into your daily workflow. The trick is telling the difference between genuinely useful features and flashy extras that don't add real value.
The tools available range from simple, free online calculators to full-featured property management platforms with built-in analytics. A basic calculator is fine for a quick, one-off estimate, but its usefulness ends there. If you're serious about minimizing vacancy, a more powerful solution is usually a better long-term investment.
What to Look for in a Vacancy Calculator Tool
When you're comparing options, focus on features that give you information you can actually act on. Don't get sidetracked by a cluttered dashboard; prioritize clarity and function. The best tools provide:
- Customizable Inputs: Can you tweak variables for different property types, locations, or even seasonal trends? A one-size-fits-all approach is a major red flag.
- Integration Capabilities: Does the tool play nice with your existing property management software? Smooth integration saves countless hours of manual data entry and cuts down on human error.
- Real-Time Data Tracking: Seeing vacancy costs add up every single day is a powerful motivator. It turns an abstract annual loss into a tangible, immediate problem that you'll want to solve quickly.
- Performance Reporting: Look for tools that not only calculate the cost but also help you track your progress over time as you roll out new strategies to fill units faster.
Platforms like Showdigs are built with this in mind, automating many of the manual tasks that stretch out vacancy periods.
This screenshot shows how a modern leasing platform displays key performance indicators, giving managers a clear snapshot of their leasing funnel's health. The most important takeaway here is the focus on action-oriented metrics like tour volume and application rates—these are the numbers that tell you how quickly a vacancy will actually be filled.
To help you navigate your options, here’s a look at some popular tools and how they stack up.
As you can see, the best tool really depends on the size of your portfolio and your primary goals. While a spreadsheet offers total control, platforms like Showdigs are built to actively reduce vacancy costs through automation and operational efficiency.
Free Tools vs. Premium Solutions
So, when is a free tool good enough, and when should you spring for a premium platform? A free online cost of vacancy calculator is perfect for a landlord with one or two properties who just needs an occasional estimate. However, for property managers overseeing a larger portfolio, the investment in a premium tool often pays for itself many times over.
These advanced platforms don't just calculate past losses; they help prevent future ones by making your operations more efficient. They can automate lead responses, schedule showings 24/7, and give you data on which marketing channels are actually working. This proactive approach is exactly what helps you reduce your vacancy days from 25 to 15, a key goal that directly pads your bottom line.
Ultimately, changing how you fill empty units is one of the most effective strategies you have. You can find more practical advice in our guide covering 7 ways to lease quicker and cheaper. Choosing the right tool isn't just about doing math—it's about building a more efficient and profitable leasing engine.
Turning Calculations Into Profitable Action Plans
Figuring out the exact number from your cost of vacancy calculator is just the beginning. The real magic happens when you use that data to plug financial leaks and improve your returns. Knowing a vacancy costs you $4,000 is one thing; using that number to make smarter, faster decisions is what sets successful property managers apart from those always playing catch-up.
It’s easy to get caught in "analysis paralysis"—running the numbers over and over but never actually changing your strategy. To get ahead, you need to use your vacancy cost data as a practical tool for every part of your leasing process.
Strategic Pricing and Marketing Adjustments
One of the quickest ways to put your vacancy cost data to work is by fine-tuning your rental price. If you know a 30-day vacancy will set you back $3,500, you can confidently decide if dropping the rent by $100 a month is a wise move. Often, a slightly lower rent that attracts a great tenant in one week instead of four results in a significant net financial gain over the year.
This data also helps justify a more assertive marketing spend. When you realize you're losing $120 every single day a property sits empty, spending an extra $300 on premium listing placements or professional photos to fill it five days sooner is no longer an expense—it's an investment with a clear, positive return. To speed things up even more, savvy property managers are adopting new tactics. You can learn more by reading our guide on how to lease your properties quicker in 2024.
Data-Driven Property Improvements and Security
Your vacancy cost can also be your guide for deciding when renovations make financial sense. Are you on the fence about spending $5,000 on a kitchen update? If your research shows a modern kitchen reduces the average vacancy time in your market by 30 days, your own calculator will prove the project pays for itself almost immediately.
- Focus on high-ROI updates: Prioritize improvements that directly shorten vacancy periods, like fresh paint, modern light fixtures, or upgraded appliances.
- Listen to tenant feedback: Use information from exit interviews to understand what improvements will not only attract new tenants but also retain them.
- Secure your asset: A vacant property is a vulnerable one. Once you’ve calculated the potential financial losses, it's crucial to be proactive. You can explore real-world protection strategies for vacant property to safeguard your investment from vandalism or theft, which only adds to your costs.
By linking every decision back to its impact on your vacancy cost, you build a system where your properties spend more time earning you money and less time draining your bank account. This data-first mindset is the key to transforming a simple calculation into a powerful tool for profitability.
Your Implementation Roadmap and Success Metrics
You've got the formulas and seen the real-world examples. Now, it’s time to take the cost of vacancy calculator from a one-off tool and make it a core part of your property management routine. This isn't about adding another chore to your to-do list; it’s about creating a system where tracking vacancy costs becomes second nature. The real goal here is to build a clear path from calculation to profitable action.
Laying the Groundwork for Consistent Tracking
To get started, you need a simple, repeatable process. Don't get lost in complicated spreadsheets right away. Instead, focus on establishing a baseline. For the next 90 days, make a commitment to calculate the total cost of vacancy for every single unit that turns over. This initial period is all about gathering property-specific data that will sharpen the accuracy of your future calculations.
One of the biggest hurdles is inconsistency. It’s easy for a property manager to track costs diligently for a month, only to get swamped and fall back into old habits. To avoid this, build the calculation directly into your turnover checklist. Make it the very last step you complete before closing out a work order for a vacant unit. For a structured approach to putting these insights into practice, a digital transformation roadmap template can provide a solid framework to ensure new processes stick for the long haul.
Identifying and Measuring What Matters
Success isn't just about knowing your total vacancy cost; it's about watching that number shrink over time. To see real improvement, you need to focus on a few key performance indicators (KPIs) that have a direct impact on your bottom line:
- Average Days on Market (DOM): This is your most important metric. Your main objective should be to reduce the time a property sits empty. Set a realistic goal, like a 10-15% reduction in your average DOM within the first six months.
- Cost Per Lease: This includes all the turnover and marketing expenses tied to filling one vacancy. When you see this number go down, you know your marketing dollars are working harder and more efficiently.
- Lead-to-Lease Conversion Rate: This tells you how well your team converts inquiries into signed leases. A higher rate means you're not just getting more leads, but you're getting the right ones.
Don't just track these numbers in a vacuum—celebrate the victories. When your team successfully cuts a property's vacancy from an average of 28 days down to 18, share that win. It reinforces the value of what you're doing and keeps everyone motivated and focused on long-term profitability.
Ready to stop losing money on empty units and start leasing faster? The Showdigs leasing automation platform is your all-in-one solution for reducing vacancy days and maximizing your ROI. Schedule a demo today to see how our AI-backed technology and on-demand agent network can transform your leasing funnel.