When you're evaluating investment opportunities across a large portfolio, you need a quick, reliable metric to filter deals. The Gross Rent Multiplier (GRM) is that go-to tool. It’s a simple efficiency calculation: Property Price ÷ Gross Annual Rent = GRM.
Think of it this way: the GRM tells you, in years, how long it would take for a property's gross rental income to pay back the asset's purchase price. For operations directors and portfolio managers, it’s a fast, high-level snapshot that helps you decide where to focus your team's limited due diligence resources, ensuring you never miss a high-potential acquisition while avoiding over-priced duds.
Understanding Gross Rent Multiplier And Why It Matters for Scalability
If you're managing a portfolio with hundreds or thousands of units, you can't afford a deep financial dive for every potential acquisition. The operational drag would be immense. This is where the GRM proves its value—it's your first-pass filter for scalable growth.
This metric lets you rapidly compare dozens of potential investments and see how they stack up against each other and market benchmarks. It helps you flag properties that might be over or undervalued, enabling your acquisitions team to focus their time on assets that align with your portfolio's financial goals. It’s not about making the final call; it's about making your initial screening process ruthlessly efficient.
Breaking Down The GRM Formula
The power of the GRM is its simplicity, but for it to be a reliable KPI, your inputs must be standardized across your entire analysis process.
- Property Price: This must be a consistent figure—whether it's the asking price, a recent appraisal, or broker price opinion (BPO). The key is to use the same valuation method for every property to ensure a true apples-to-apples comparison.
- Gross Annual Rent: This is the total potential rental income over 12 months before deducting operating expenses like taxes, insurance, maintenance, or vacancy loss.
For example, your team is evaluating a 10-unit building listed for $1,200,000. Its gross annual rental income is $150,000. The calculation is $1,200,000 ÷ $150,000, resulting in a GRM of 8.0. This means it would take eight years of gross rent to pay back the purchase price, ignoring all operational costs.
To standardize this across your operations, use a clear framework.
GRM Formula Components for Portfolio Analysis
ComponentDefinition for Enterprise OperationsExampleProperty PriceThe consistent value used for comparison, such as the current market value or asking price, standardized across all evaluations.A multi-unit property with an appraised value of $1,200,000.Gross Annual RentThe total scheduled rental income for a 12-month period, before any deductions for vacancy loss or operating expenses.The property generates $150,000 in total scheduled rent per year.GRM CalculationProperty Price / Gross Annual Rent$1,200,000 / $150,000 = 8.0 GRM
This table provides a simple framework to ensure your team gathers inputs consistently, making your cross-portfolio comparisons valid.
A lower GRM often indicates a faster payback period on paper, which can make a property look highly attractive. However, an unusually low GRM for a specific submarket can be a red flag for higher operational costs or underlying asset issues.
By running this calculation, your team can quickly build a shortlist of promising assets. This ensures that when they commit resources to deep due diligence—like analyzing P&L statements and vacancy rates—they’re focusing on properties with the highest potential ROI. Tracking the right leasing metrics is the foundation of a scalable property management operation, and GRM is the ideal starting point for acquisition analysis.
Gathering Accurate Data for Your GRM Calculation
A high-level metric like the Gross Rent Multiplier is only as reliable as the data fed into it. For property management companies operating at scale across distributed portfolios, a standardized data-gathering process is non-negotiable. It’s the only way to generate valid, apples-to-apples comparisons across different assets and markets.
Your GRM calculation depends on two key figures: the property's price and its gross annual rent. Let's establish the operational best practices for sourcing this data.
Establishing a Defensible Property Price
The "price" used in your GRM calculation cannot be an arbitrary figure. It must be a defensible, current market value to ensure your analysis is grounded in reality. Before calculating GRM, it's essential to understand how to accurately determine fair market value.
To maintain consistency across your portfolio analysis, rely on these documented valuation methods:
- Recent Appraisals: The gold standard for establishing a property's current market value, providing a legally defensible figure.
- Broker Price Opinions (BPOs): A cost-effective and rapid method for getting an informed valuation from a real estate professional active in the target submarket.
- Recent Comps: Analyzing recent sales of similar properties (in size, age, and unit mix) within the immediate area provides a real-time pulse on market pricing.
Calculating Realistic Gross Annual Rent
This is where many acquisition models falter due to overly optimistic projections, skewing the entire GRM calculation.
It is crucial to distinguish between Potential Gross Income (PGI) and Effective Gross Income (EGI). PGI represents the theoretical maximum rent if every unit were occupied 100% of the time—a useful baseline, but not a reflection of reality.
Effective Gross Income (EGI) is the more realistic figure, accounting for potential revenue loss from vacancies and credit issues. While GRM traditionally uses PGI, sophisticated operators often run both calculations to understand the spread.
For a true performance-based GRM on existing assets, the trailing 12-month (T12) rental income from your property management software is the most reliable data source. This historical data provides an unvarnished view of actual revenue performance. When setting rents for new acquisitions, it's always best practice to use Zillow to validate your rent against current market listings to ensure your pro-forma is competitive.
Key Takeaway for Scaled Operations: Never use pro-forma or projected rents for GRM calculations on existing properties. Always pull actual T12 data from your system of record (e.g., AppFolio, Yardi). This grounds your analysis in reality and ensures investment decisions are based on proven performance, not wishful thinking.
Putting GRM to Work in Your Portfolio Strategy
Let's move from theory to practical application. This is where the Gross Rent Multiplier proves its worth as a strategic tool for making rapid, data-informed decisions at scale. Savvy portfolio managers use GRM as a first-pass filter to efficiently analyze dozens of deals and allocate resources with confidence.
Here are two common scenarios where knowing how to calculate gross rent multiplier can directly impact your acquisition and leasing strategies.
Getting a Quick Market Value on a Potential Purchase
Imagine your team is evaluating a property in a new submarket. Market analysis shows that comparable properties in the area are trading at a GRM of 8.5. The building you're targeting generates $120,000 in gross annual rent.
You can reverse the GRM formula to estimate its approximate market value:
- Market Value = Gross Annual Rent × Market GRM
- Market Value = $120,000 × 8.5 = $1,020,000
If the seller's asking price is $1,200,000, this simple calculation is an immediate red flag. The property is likely priced at a significant premium to the local market. Conversely, if it’s listed at $900,000, it signals a potential opportunity that warrants deeper due diligence. This back-of-the-napkin math helps your team focus its energy and avoid wasting cycles on overpriced assets.
This visual guide breaks down the simple three-step process of calculating and interpreting the Gross Rent Multiplier for your team.
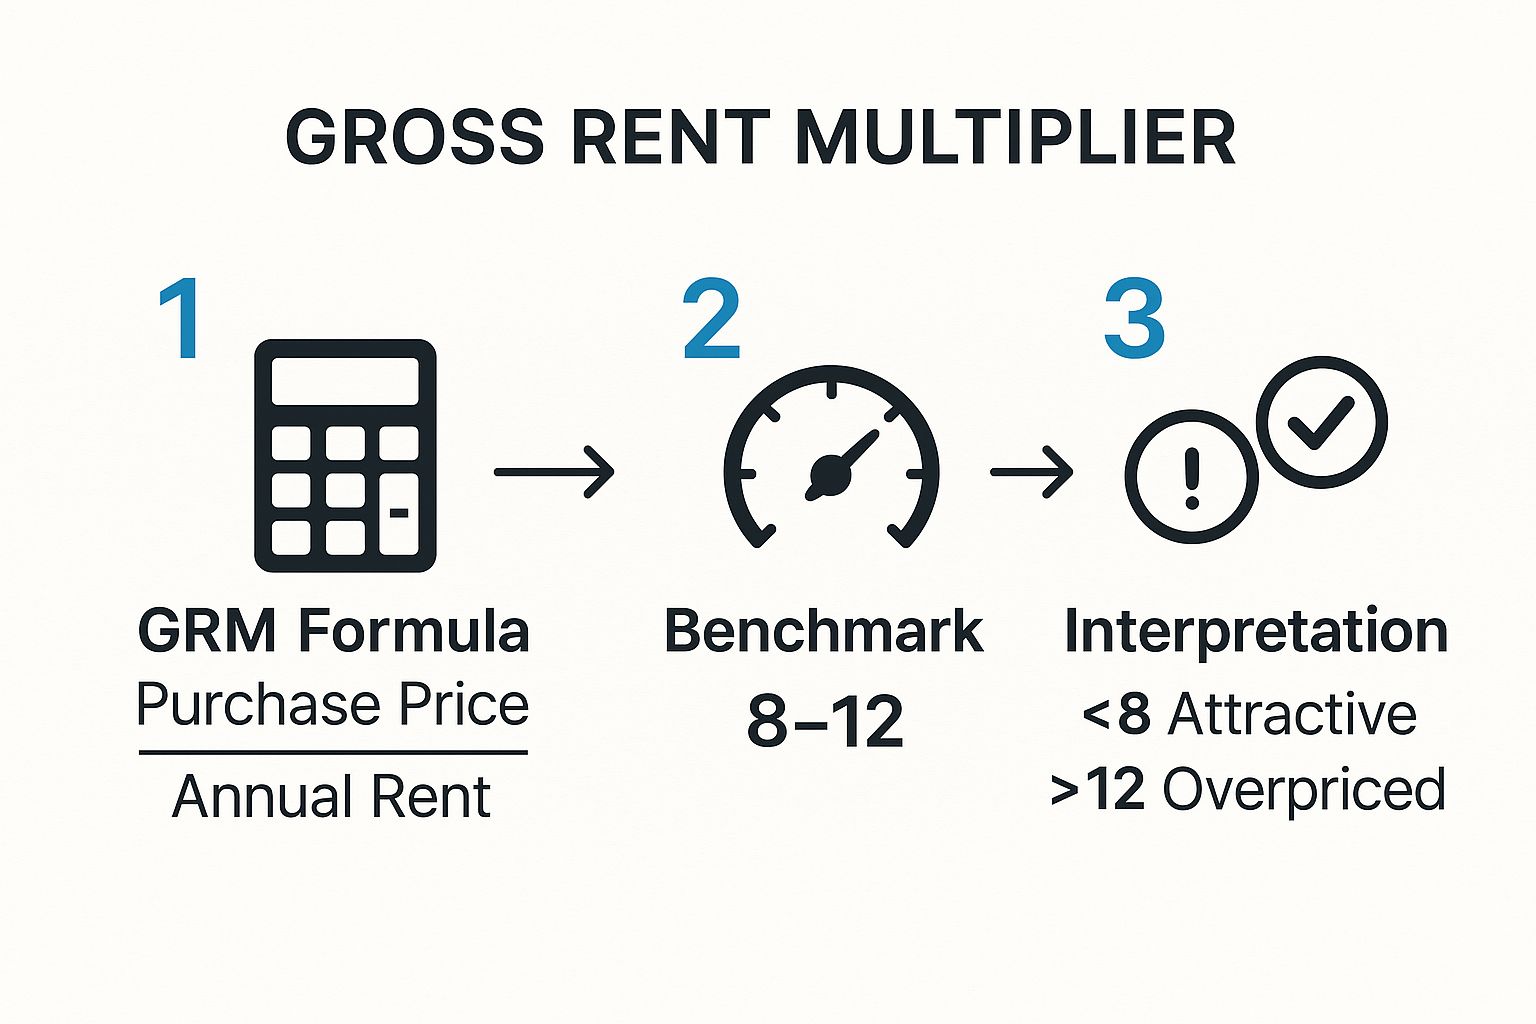
As the infographic illustrates, you're not just calculating a number; you're establishing a benchmark to quickly assess whether a property aligns with your investment criteria.
Setting Pro-Forma Rents for a New Acquisition
Now, let's reverse the scenario. You've just acquired a property for $400,000. You know the target GRM for similar assets in this market is 7.5. You can use this benchmark to determine the gross annual rent required to meet market expectations.
In the fast-paced world of investment analysis, GRM is your quick screening tool. For example, with a market GRM of 7.5 and a $400,000 property, you can quickly determine that you need to generate approximately $53,333 in gross annual rent ($400,000 ÷ 7.5). The experts at Stessa.com offer more great insights on using GRM for fast property valuations.
The math shows your target annual rent roll should be around $53,333, which breaks down to $4,444 per month.
If your initial pro-forma projections were significantly lower, this is a clear indicator that you may have an opportunity to increase rents. If you were projecting higher rents, you might face extended vacancy periods and slower lease-up, impacting your Days on Market (DOM). GRM provides a data-driven foundation for your entire leasing strategy.
Interpreting GRM: What a "Good" Number Looks Like Across Markets
So you've calculated a property's Gross Rent Multiplier. Now what? A GRM figure in isolation is meaningless. To make it a useful KPI for your portfolio, you must understand what it signals about a property's value relative to its income-generating potential.
At its core, the relationship is straightforward: a lower GRM generally suggests a shorter payback period based on gross rent. A higher GRM can indicate an overvalued asset or a longer timeline to recoup the initial investment. Think of it as a quick financial health check—a lower number often appears more robust at first glance.
However, the most critical factor for large-scale operators is that a "good" GRM is not a universal constant. It varies dramatically based on geography, property condition, and asset class.
The Power of Local Context in Portfolio Management
The biggest mistake an acquisitions team can make is comparing a property's GRM in one market to a national average. This is a recipe for poor investment decisions. The real strategic value of GRM comes from benchmarking a property against its direct competitors in the same submarket.
For example, GRMs in prime urban cores like New York or San Francisco can range from 15 to 20+ due to high property values and appreciation expectations. In contrast, stable secondary markets might exhibit GRMs between 7 and 10, signaling a faster payback period. This significant variance underscores why local context is paramount. You can find more GRM insights for different markets on PropertyMetrics.com.
To put this into perspective, here’s how GRM benchmarks can differ by market tier.
Typical GRM Ranges by Market Type
This table breaks down expected ranges in various real estate markets, providing a baseline for your own analysis.
Market TypeTypical GRM RangeInvestment Implication for Large PortfoliosTier 1 Urban Core (e.g., NYC, SF)12 - 20+High property values, strong appreciation potential, but longer income payback.Stable Suburban Markets8 - 12A balanced blend of cash flow and appreciation; often a "sweet spot" for SFR and multifamily portfolios.Secondary/Tertiary Cities5 - 8Stronger cash flow focus, lower acquisition costs, but potentially slower long-term appreciation.High-Risk or Declining Areas< 5Appears to have a very fast payback, but often indicates high operational costs, deferred maintenance, or market instability.
As you can see, a GRM of 9 could be a fantastic deal in a stable suburban market but might signal an overpayment in a smaller city where the norm is 6.
Key Takeaway for Portfolio Managers: Abandon the search for a universal "good" GRM. Instead, your operational mandate should be to establish and maintain baseline GRM benchmarks for each specific submarket you operate in. A property’s GRM is only valuable when compared against local, comparable assets. This approach transforms a simple metric into a powerful tool for identifying true market outliers and hidden opportunities.
Your analysis must always answer the question: "How does this property's GRM compare to similar assets in this specific neighborhood?" That localized lens is what separates a scalable investment strategy from a series of costly mistakes.
Beyond GRM: When to Use More Advanced Metrics
The Gross Rent Multiplier is an excellent tool for building the top of your acquisition funnel. We use it for rapid, high-level screening. But its simplicity is also its greatest limitation. For sophisticated operators scaling a large portfolio, relying solely on GRM for final investment decisions is a critical error.
Why? GRM completely ignores operating expenses.
The metric tells you nothing about the real costs of ownership—property taxes, insurance, maintenance, property management fees, and utilities. You could have two adjacent properties with identical GRMs but wildly different profitability profiles. One might be a newer build with low upkeep, while the other is an older asset requiring significant capital expenditures. The result is a massive gap in net operating income (NOI) and cash-on-cash return.
Moving From Screening to Due Diligence
Think of GRM as your high-level tool for market scanning and initial comparisons. It helps you efficiently sift through dozens of listings to identify properties that warrant a closer look. But once an asset makes your shortlist, it’s time to escalate to more rigorous financial analysis.
This is the critical transition from evaluating top-line revenue to scrutinizing bottom-line profitability. Failing to drill down into operating expenses is how portfolios become burdened with assets that look great on paper but consistently underperform financially.
Introducing NOI and Cap Rate
For final due diligence, underwriting, and accurate budgeting, your team must shift to metrics based on Net Operating Income (NOI). NOI provides a clear picture of a property's profitability by subtracting all operating expenses from its gross income.
From NOI, you can calculate the Capitalization Rate (Cap Rate). For a deeper dive, understanding what a Cap Rate in Real Estate Investing is will provide a much clearer view of an asset's unlevered return.
Here’s a simple operational workflow:
- GRM: Use for high-volume, initial screening of potential deals.
- Cap Rate & NOI: Use for detailed financial modeling and final acquisition decisions.
Integrating both metrics into your acquisition process is essential for scaling a profitable portfolio and is one of the key ways to boost your property's ROI.
Got Questions About GRM? We've Got Answers.
Even for seasoned professionals managing large portfolios, a few key questions about the Gross Rent Multiplier frequently arise. When you're making decisions that impact hundreds or thousands of units, clarity on these core metrics is crucial for effective execution.
What's the Real Difference Between GRM and Cap Rate?
The fundamental difference lies in what they measure. The Gross Rent Multiplier is a top-line revenue metric, evaluating a property's price relative to its gross annual rent. It completely ignores all operating expenses. Think of it as a first-glance screening tool.
In contrast, the Capitalization Rate (Cap Rate) is a profitability metric because it uses Net Operating Income (NOI). Since NOI accounts for real-world operating expenses like taxes, insurance, and maintenance, Cap Rate provides a far more accurate indication of an asset's financial performance.
The bottom line: GRM assesses potential revenue efficiency, while Cap Rate measures actual profitability. For final acquisition decisions, Cap Rate analysis is non-negotiable.
Can I Use GRM for Commercial Properties?
While you technically can, it is not recommended for most commercial asset classes. GRM is designed primarily for residential properties, where operating expenses are often more predictable as a percentage of gross income.
Commercial properties are far more complex. Operating costs can vary dramatically due to triple net (NNN) leases, extensive common area maintenance (CAM) charges, and fluctuating utility consumption. Because GRM ignores these critical and variable expenses, it can be a dangerously misleading metric for office, retail, or industrial assets.
How Do Vacancy Rates Impact My GRM Calculation?
Vacancy rates can completely invalidate your GRM calculation if not handled correctly. Using potential gross rent (assuming 100% occupancy) will make an investment appear significantly more attractive on paper than it is in reality.
For a realistic analysis, you must use effective gross income, which is your potential rent minus a provision for vacancy and credit loss. This is absolutely critical for large, distributed portfolios, where a mere 1-2% variance in vacancy across thousands of units can translate into millions of dollars in lost revenue, fundamentally altering the investment thesis.
Ready to slash vacancy days and convert more leads into leases? Showdigs streamlines your entire leasing funnel with AI-backed automation and an on-demand network of showing agents. Cut your days on market and maximize your portfolio's revenue. Learn how Showdigs can optimize your operations.