
Unlocking Property Management Success with KPIs
For property managers, large portfolio owners, and tenant placement companies, data-driven decisions are crucial. This listicle reveals eight essential property management key performance indicators (KPIs) to track in 2025. Learn how monitoring metrics like occupancy rate, net operating income (NOI), tenant turnover rate, and more empowers informed decisions, boosts profitability, and streamlines operations. Mastering these property management KPIs is key to thriving in the competitive real estate market.
1. Occupancy Rate
Occupancy rate is a cornerstone key performance indicator (KPI) in property management, providing a snapshot of a property's success in attracting and retaining tenants. It represents the percentage of occupied rental units out of the total available units during a specific time period, offering valuable insights into revenue potential and overall property performance. This metric is crucial for property managers, owners of large rental portfolios, and tenant placement companies alike, as it directly impacts profitability and investment returns. Its importance in assessing market demand, pricing strategies, and operational efficiency earns it a top spot on the list of property management key performance indicators.
This fundamental metric is calculated using a straightforward formula: (Occupied Units / Total Available Units) × 100. This calculation can be performed monthly, quarterly, or annually, providing flexibility in tracking performance trends over different time horizons. For example, a 200-unit apartment complex with 185 occupied units boasts a 92.5% occupancy rate. Understanding industry benchmarks is essential for context; these typically range from 85-95%, varying by property type and location. For instance, retail shopping centers often aim for occupancy rates of 95% or higher, while student housing might achieve 98% occupancy during the academic year.
Occupancy rate offers several advantages as a KPI. Its direct correlation to revenue generation allows property managers to quickly assess the financial health of their investments. The simplicity of its calculation and tracking makes it an accessible and efficient metric. As a widely recognized industry standard, it facilitates clear communication and benchmarking against competitors. Furthermore, monitoring occupancy rates over time helps identify market demand patterns, enabling informed decision-making regarding pricing and marketing strategies.
However, relying solely on occupancy rate can be misleading. It doesn't account for rent collection issues, meaning a high occupancy rate could mask underlying financial challenges. Similarly, it may not accurately reflect actual cash flow, particularly if rent collection is delayed or inconsistent. Seasonal fluctuations can significantly skew short-term data, making it crucial to analyze long-term trends. Finally, paradoxically, a consistently high occupancy rate might indicate that the property is underpriced, leaving potential revenue on the table.
Tracking both physical and economic occupancy is essential for a comprehensive understanding of performance. Physical occupancy simply refers to the units that are physically occupied by tenants, whereas economic occupancy takes into account the actual revenue generated from those units. This distinction is crucial for identifying discrepancies between occupied units and actual income. Monitoring seasonal trends and adjusting expectations accordingly prevents misinterpretations of short-term fluctuations. Comparing occupancy rates against local market averages provides valuable context and identifies areas for potential improvement. Finally, setting realistic targets based on property type and location ensures achievable goals aligned with market dynamics.
The following bar chart compares industry benchmark occupancy rates for three common property types: Residential, Commercial Office, and Retail. This visualization helps to contextualize occupancy rate performance and understand typical ranges for different sectors of the real estate market.
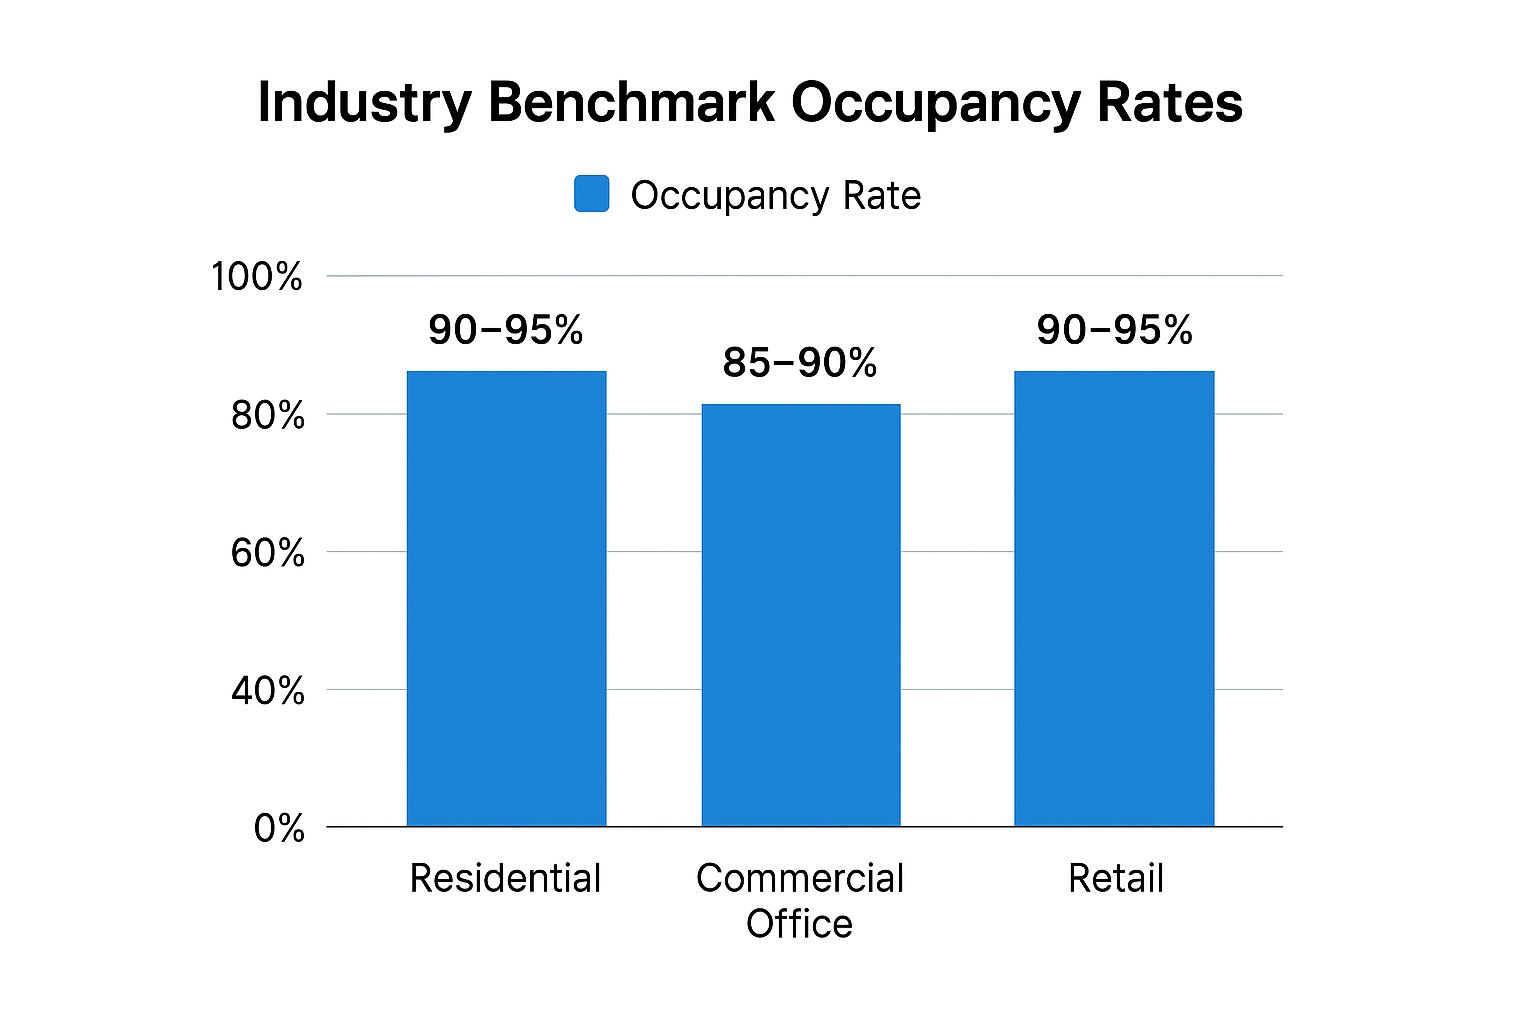
As the infographic illustrates, Residential and Retail properties tend to achieve higher occupancy rates (90-95%) compared to Commercial Office spaces (85-90%). This highlights the differing market dynamics and demand patterns across various property types. Understanding these benchmarks allows property managers to set realistic occupancy targets and tailor their strategies accordingly. By leveraging occupancy rate as a key performance indicator, combined with a comprehensive understanding of market trends and operational efficiency, property managers can optimize their strategies for sustained success and maximize returns on investment.
2. Net Operating Income (NOI)
Net Operating Income (NOI) stands as a cornerstone metric in property management, offering a clear snapshot of a property's profitability. It represents the total income generated by a property after deducting all operating expenses, excluding financing costs like mortgage payments, capital expenditures (improvements or major repairs), and taxes. Understanding and effectively utilizing NOI is essential for property valuation, investment analysis, and making informed decisions about your real estate assets. For property managers, large portfolio owners, and tenant placement companies, NOI provides a standardized way to assess and compare the financial performance of different properties.

Calculating NOI is straightforward: subtract your total operating expenses from your gross rental income. Operating expenses encompass the everyday costs of running the property, including maintenance and repairs, property management fees, insurance, utilities, property taxes, and marketing costs. It's crucial to distinguish between operating expenses and capital expenditures. Replacing a broken window is an operating expense, while renovating a lobby or installing a new HVAC system is a capital expenditure and thus not factored into NOI. This distinction is vital because NOI aims to isolate the income generated purely from the property's operations.
NOI is typically measured annually or quarterly, allowing property managers to track performance trends and identify potential areas for improvement. Its importance in property management key performance indicators stems from its direct link to a property's value and its ability to reveal operational efficiencies. For instance, a high NOI suggests efficient management and strong income generation, making the property more attractive to potential buyers or investors.
Why NOI Matters in Property Management
NOI plays a pivotal role in several key aspects of property management:
- Property Valuation: NOI is a core component of the capitalization rate (cap rate) formula, a fundamental metric used to determine a property's market value. The cap rate is calculated by dividing NOI by the property's value. Therefore, a higher NOI generally translates to a higher property value.
- Investment Analysis: Investors rely heavily on NOI to assess the potential return on investment for a property. Comparing the NOI of different properties helps identify the most lucrative opportunities.
- Performance Benchmarking: NOI allows property managers to benchmark their properties' performance against similar properties in the market, revealing areas where they excel or need improvement.
- Expense Optimization: By analyzing the components of NOI, property managers can pinpoint areas where expenses can be reduced without compromising the quality of service, thereby boosting profitability.
- Refinancing and Loan Applications: Lenders often require NOI figures when assessing loan applications for property acquisitions or refinancing, using it as an indicator of the property's ability to generate sufficient income to cover loan payments.
Examples of Successful NOI Implementation:
- An office building generates $1.2 million in gross rental income and incurs $400,000 in operating expenses. Its NOI is $800,000. This figure can then be used to calculate the cap rate and determine the property's market value.
- An apartment complex implements a series of energy-efficient upgrades, reducing utility costs and increasing its NOI by 8% year over year.
- A shopping center strategically manages its tenant mix and lease terms, leading to increased occupancy and higher rental income, improving its NOI margin from 65% to 72% over three years.
Tips for Utilizing NOI Effectively:
- Track NOI Trends: Monitor NOI over multiple years to identify patterns and assess the long-term financial health of your property.
- Benchmark Against Comparables: Compare your property's NOI to that of similar properties in the market to gauge its performance relative to its peers.
- Focus on Both Income and Expenses: While increasing income is crucial, controlling expenses is equally important for maximizing NOI.
- Use NOI for Investment Decisions: Leverage NOI data to inform investment decisions, including acquisitions, dispositions, and renovations.
- Accurate Expense Tracking: Maintaining accurate records of all operating expenses is crucial for calculating a reliable NOI.
Pros and Cons of Using NOI:
Pros:
- Provides a clear picture of operational profitability.
- Essential for property valuation and investment analysis.
- Helps identify opportunities for expense optimization.
- Crucial for refinancing and investment decisions.
Cons:
- Does not include capital expenditures, which can be significant.
- Can be manipulated through expense timing.
- Does not reflect cash flow to owners after debt service.
- Requires meticulous expense tracking for accuracy.
Despite its limitations, NOI remains an indispensable metric in property management. By understanding its calculation, applications, and limitations, property managers, owners, and investors can leverage this powerful tool to make informed decisions and optimize the financial performance of their real estate assets.
3. Tenant Turnover Rate
Tenant turnover rate is a crucial property management key performance indicator (KPI) that reveals the percentage of tenants vacating and being replaced within a specific period, typically a year. This metric provides valuable insights into tenant satisfaction, the effectiveness of property management strategies, and directly influences operational costs and revenue stability. A high turnover rate often signifies underlying issues like poor property maintenance, inadequate amenities, or ineffective communication, leading to increased expenses related to marketing, tenant screening, and unit preparation. Conversely, a healthy turnover rate indicates tenant contentment and efficient property management practices. Monitoring this KPI allows property managers to proactively address potential problems, optimize their strategies, and ultimately enhance their bottom line.
Calculating the tenant turnover rate is straightforward: divide the number of move-outs within the year by the average number of occupied units and multiply the result by 100. For example, if a property with an average occupancy of 100 units experiences 50 move-outs in a year, the turnover rate is 50%. While an annual measurement provides consistency, it's essential to understand that turnover rates vary significantly depending on the property type. Student housing, for instance, naturally experiences a much higher turnover rate compared to commercial office spaces or single-family homes. Importantly, the calculation includes both voluntary and involuntary departures, encompassing everything from lease expirations and tenant-initiated moves to evictions.
The benefits of tracking tenant turnover rate are numerous. For one, it provides a clear indication of tenant satisfaction levels. A consistently high rate can signal underlying issues that need addressing. Secondly, understanding turnover patterns allows for more accurate predictions of future vacancy costs, facilitating better budgeting and resource allocation. It also serves as a valuable tool for evaluating management effectiveness, highlighting areas where improvements can be made, whether in maintenance, communication, or tenant relations. Finally, a well-understood turnover rate aids in budgeting for associated expenses like cleaning, repairs, and marketing.
However, there are some limitations to consider. Some degree of natural turnover is inevitable, as tenants’ life circumstances change. The metric itself may not distinguish between positive and negative departures – a tenant relocating for a job promotion versus a tenant leaving due to dissatisfaction. Seasonal variations can also impact the accuracy of the data, as certain times of the year typically see higher moving activity. Furthermore, the standard calculation doesn't account for differences in lease lengths, which can skew the results.
To illustrate, consider these examples: Class A apartments, often attracting longer-term tenants, typically maintain an annual turnover rate between 45-55%. In contrast, student housing, due to the nature of academic cycles, might experience 80-100% turnover annually. Commercial office spaces, often focusing on long-term leases and tenant retention programs, can achieve significantly lower rates, sometimes as low as 15%.
So, when and why should property managers focus on this KPI? Tenant turnover rate should be a continuous consideration, especially for those managing larger portfolios or experiencing fluctuating occupancy rates. It’s particularly important for property management companies striving to optimize operational efficiency, improve tenant satisfaction, and maximize profitability. Single-family property managers can leverage this KPI to refine their tenant screening processes and improve property features to attract longer-term residents. For large rental portfolio owners, understanding turnover trends across different property types can inform strategic investment decisions. Tenant placement companies can use this data to tailor their services and better match tenants with suitable properties.
To effectively manage and leverage tenant turnover rate, consider these actionable tips: Conduct exit interviews to gather valuable insights into tenants' reasons for leaving. Implement proactive tenant retention programs, such as offering lease renewals with incentives or organizing community events. Track voluntary and involuntary turnover separately to identify specific areas for improvement. Finally, monitor industry benchmarks for your specific property type to assess your performance relative to the market. Learn more about Tenant Turnover Rate to delve deeper into strategies for tenant retention. By actively monitoring and analyzing tenant turnover rate, property managers can gain a competitive edge, optimize their operations, and cultivate thriving rental communities.
4. Average Days to Lease
Average Days to Lease is a crucial property management key performance indicator (KPI) that measures the efficiency of your leasing process. It represents the average time it takes to fill a vacant unit, starting from the day it becomes available to when a new tenant signs a lease. This metric provides valuable insights into the effectiveness of your marketing strategies, the competitiveness of your pricing, and the overall demand for your properties. Tracking and analyzing Average Days to Lease empowers you to optimize your operations, maximize occupancy rates, and improve your bottom line.
This KPI is calculated by summing the number of days each unit remains vacant within a specific period and dividing it by the total number of units that became vacant during that same period. For example, if three units were vacant for 15, 20, and 25 days respectively, the Average Days to Lease would be (15+20+25)/3 = 20 days. It's important to track this metric consistently across all unit types and sizes to identify specific areas for improvement. Remember that seasonal variations are common, with shorter lease-up times often experienced during peak seasons. The calculation includes the entire period from vacancy to lease execution, encompassing marketing, showings, and application processing.
Why is Average Days to Lease such a valuable property management key performance indicator? For several reasons: it directly impacts your revenue stream. Every day a unit sits vacant represents lost income. By minimizing vacancy periods, you maximize your cash flow and return on investment. Furthermore, this metric helps you gauge the health of your leasing process. A high Average Days to Lease can indicate problems with your marketing, pricing, or even the property itself. Conversely, a consistently low number suggests a strong market position and efficient operations.
The advantages of monitoring Average Days to Lease are numerous. It allows you to measure the effectiveness of your marketing campaigns and identify which channels generate the fastest results. It informs your pricing strategies by indicating whether your rents are aligned with market expectations. A prolonged vacancy period might suggest that your rents are too high, while a rapid lease-up might indicate room for increase. Furthermore, this KPI provides a snapshot of the overall market demand for your property type and location. This information is essential for long-term planning and investment decisions. Finally, understanding your Average Days to Lease enables more accurate cash flow projections and budgeting.
However, like any KPI, Average Days to Lease has its limitations. External market conditions, such as economic downturns or increased competition, can significantly influence this metric, even with optimal internal processes. An overemphasis on speed can also lead to rushed tenant selection, potentially resulting in higher turnover rates and problematic tenancies down the line. Furthermore, seasonal fluctuations can complicate year-over-year comparisons, requiring careful analysis and contextualization. Finally, while this KPI measures the speed of leasing, it doesn't provide insights into the quality of the leases signed, such as tenant creditworthiness or lease duration.
Several examples illustrate the practical application of this KPI. An urban apartment complex might reduce its Average Days to Lease from 45 to 28 days by implementing targeted online marketing campaigns and optimizing its listing presentations. A suburban office park might maintain a consistent 60-day average lease-up time, reflecting the typical leasing cycle for commercial properties in its area. Student housing complexes often achieve remarkably short Average Days to Lease, sometimes as low as 14 days, during the peak leasing season just before the academic year begins.
To effectively utilize Average Days to Lease, consider these actionable tips: Track the metric by unit type and season to identify trends and anomalies. Benchmark your performance against local competitors to understand your market position. Continuously optimize your marketing channels based on performance data, focusing on those that deliver the quickest results. Finally, remember to strike a balance between speed and tenant quality. While minimizing vacancy is important, prioritize attracting reliable, long-term tenants. Learn more about Average Days to Lease for additional strategies to improve your leasing process. By consistently monitoring and analyzing this important property management key performance indicator, you can significantly enhance your leasing performance and overall profitability.
5. Operating Expense Ratio
The Operating Expense Ratio (OER) is a crucial property management key performance indicator (KPI) that reveals how efficiently a property is being managed. It represents the percentage of a property's gross operating income consumed by operating expenses. By calculating and monitoring the OER, property managers can identify areas for cost control, benchmark their performance against competitors, and make informed decisions about budgeting and forecasting. This metric is essential for single-family property managers, property management companies, large rental portfolio owners, and tenant placement companies alike, as it provides valuable insights into profitability and operational efficiency.
How It Works:
The OER is calculated using a straightforward formula:
Operating Expense Ratio (OER) = (Operating Expenses ÷ Gross Rental Income) × 100
Operating Expenses: These include all the costs associated with running the property, such as property taxes, insurance, maintenance, repairs, utilities, property management fees, landscaping, and cleaning. It's important to note that the OER excludes debt service (mortgage payments) and capital expenditures (major improvements or renovations). These are considered capital investments rather than operational costs.
Gross Rental Income: This represents the total rental income collected before deducting any operating expenses. Things like vacancy losses will affect the gross rental income, providing a more realistic picture of actual income generation.
Why the OER Matters:
The OER deserves its place on the list of essential property management key performance indicators for several reasons. A lower OER generally signifies higher efficiency and profitability. By tracking the OER over time, property managers can identify trends, pinpoint areas where costs are rising, and implement strategies to control expenses. Furthermore, the OER allows for comparison with similar properties in the market, providing a benchmark for performance and identifying areas for improvement. This is especially important for those managing large portfolios, enabling them to quickly assess the relative performance of different properties.
Examples of Successful Implementation:
A Class A office building in a competitive market maintains a 35% OER by diligently managing its utility consumption and negotiating favorable contracts with service providers. This demonstrates efficient resource allocation and cost control.
An apartment complex successfully reduces its OER from 55% to 48% by implementing energy efficiency improvements, such as installing LED lighting and upgrading HVAC systems. This highlights the potential for reducing operational costs through strategic investments.
A shopping center achieves a low OER of 25% through effective management of Common Area Maintenance (CAM) charges, ensuring that tenants are fairly billed for their share of expenses. This proactive approach contributes significantly to the property's overall profitability.
Pros and Cons of Using the OER:
Pros:
- Easy to calculate and benchmark: The straightforward formula makes the OER readily accessible and easy to track.
- Identifies expense control opportunities: Analyzing the components of operating expenses can reveal areas where costs can be reduced.
- Useful for comparing similar properties: Benchmarking against competitors helps identify best practices and areas for improvement.
- Helps in budget planning and forecasting: Historical OER data informs future budget projections and allows for proactive cost management.
Cons:
- Doesn't account for property age or condition: Older properties may naturally have higher maintenance expenses, which the OER doesn't explicitly reflect.
- May encourage under-maintenance: Focusing solely on lowering the OER can incentivize neglecting necessary maintenance, potentially leading to larger problems down the road.
- Varies significantly by location and property type: Comparing OERs across different markets or property types can be misleading due to variations in operating costs.
- Can be misleading if income is declining: A declining gross rental income can artificially lower the OER, masking underlying performance issues.
Actionable Tips for Using the OER:
- Compare with similar properties in your market: Benchmarking against local competitors provides a realistic assessment of performance.
- Track trends over multiple years: Monitoring the OER over time reveals long-term patterns and helps identify potential problems early on.
- Focus on controllable expenses: Prioritize areas where you have direct control over costs, such as utilities, maintenance, and vendor contracts.
- Balance cost control with property maintenance: Avoid cutting corners on essential maintenance to artificially lower the OER, as this can lead to more significant expenses later.
By diligently tracking and analyzing the Operating Expense Ratio, property managers can gain valuable insights into the financial health and efficiency of their properties, ultimately contributing to increased profitability and long-term success.
6. Rent Collection Rate
Rent collection rate is a crucial property management key performance indicator (KPI) that measures the effectiveness of your rent collection processes and reflects the payment behavior of your tenants. It represents the percentage of total rent charged that is actually collected, providing a direct insight into your property's cash flow and financial health. For single-family property managers, property management companies, large rental portfolio owners, and tenant placement companies, monitoring and optimizing this KPI is essential for sustained profitability and growth.
This metric is calculated using a simple formula: (Rent Collected ÷ Rent Charged) × 100. It's typically tracked both monthly and annually to identify trends and potential issues. Importantly, the calculation should include both current and delinquent collections to provide a comprehensive overview of your financial performance. A healthy rent collection rate typically falls within the range of 95-98%, although this can vary based on market conditions, property type, and tenant demographics. Maintaining a high rent collection rate is paramount for ensuring predictable income streams, covering operational expenses, and reinvesting in your properties.
Why is Rent Collection Rate a Key Performance Indicator?
Rent collection rate directly impacts a property's profitability and financial stability. This KPI deserves its place on the list of essential property management metrics because it offers several key insights:
- Cash Flow Efficiency: It provides a clear picture of how effectively rent is being collected, revealing potential bottlenecks in the process. A low rate signifies problems that need immediate attention.
- Predictive Power: While it doesn't foresee individual tenant payment issues, a consistently high rate suggests a well-managed property and reliable tenant base, contributing to predictable future cash flows.
- Financial Planning: Accurate rent collection data is essential for budgeting, forecasting, and securing financing. Lenders and investors often scrutinize this metric to assess risk and potential returns.
- Process Evaluation: Analyzing the rent collection rate helps identify the effectiveness of current collection strategies and highlights areas for improvement.
Examples of Successful Implementation:
- An affordable housing community achieved a 96% rent collection rate by implementing payment assistance programs and offering flexible payment options tailored to residents' financial situations.
- A luxury apartment complex boasting a 99% rent collection rate attributes its success to a user-friendly online payment system, automated payment reminders, and incentives for early payment.
- A commercial property reduced its delinquency rate by 40% by implementing stricter tenant screening procedures, including credit checks, background checks, and verification of income.
Pros and Cons of Using Rent Collection Rate:
Pros:
- Directly measures cash flow efficiency.
- Identifies collection process effectiveness.
- Helps predict future cash flows.
- Essential for financial planning.
Cons:
- Can be affected by external economic factors (e.g., recessions, job losses).
- May lag behind actual tenant financial stress, providing a delayed indicator.
- Doesn't predict future payment issues for individual tenants.
- Can be temporarily inflated by payment plans, masking underlying delinquency issues.
Actionable Tips for Improving Rent Collection Rate:
- Implement Online Payment Systems: Offer convenient online payment options to streamline the payment process and reduce the likelihood of late payments.
- Offer Payment Plan Options: Provide flexible payment plans for tenants facing temporary financial hardship to encourage partial payments and avoid complete delinquency.
- Screen Tenants Thoroughly: Implement rigorous tenant screening procedures to minimize the risk of renting to tenants with a history of late payments or financial instability.
- Follow Up Quickly on Delinquencies: Establish a clear and consistent policy for following up on late payments, including automated reminders, phone calls, and legal action when necessary.
- Communicate Clearly: Maintain open communication with tenants regarding rent due dates, payment options, and late payment consequences. Proactive communication can often prevent delinquency issues.
- Offer Incentives: Consider offering small incentives for on-time payments, such as discounts or rewards, to encourage prompt payment behavior.
By actively monitoring and managing your rent collection rate, you can gain valuable insights into your property's financial performance, optimize your collection processes, and ensure long-term financial stability. This crucial KPI empowers you to make informed decisions, mitigate financial risks, and maximize your return on investment.
7. Maintenance Cost Per Unit
Maintenance Cost Per Unit is a critical property management key performance indicator (KPI) that reveals the average expenditure on maintenance and repairs for each rental unit within a specific timeframe, typically a year. This metric provides valuable insights into operational efficiency, budget adherence, and the overall financial health of a property portfolio. By meticulously tracking Maintenance Cost Per Unit, property managers can make informed decisions regarding budget allocation, preventative maintenance strategies, and long-term capital planning. This KPI is indispensable for single-family property managers, property management companies, large rental portfolio owners, and even tenant placement companies seeking to understand the financial viability of properties.
This KPI encompasses both routine maintenance tasks (like HVAC filter replacements, landscaping upkeep, and regular appliance servicing) and emergency repairs (such as plumbing leaks, electrical outages, and roof repairs). Calculating this figure annually provides a consistent benchmark for comparison year over year, allowing property managers to identify trends, pinpoint problem areas, and assess the effectiveness of maintenance strategies. It's crucial to distinguish between maintenance expenses and capital improvements. Capital improvements, such as renovations, upgrades, and additions, are considered long-term investments and are excluded from this calculation. This distinction provides a clearer picture of ongoing operational costs. Furthermore, savvy property managers can enhance the utility of this KPI by tracking costs by specific maintenance categories (e.g., plumbing, electrical, HVAC) and even by individual systems, allowing for more granular analysis and targeted cost-saving initiatives.
Tracking Maintenance Cost Per Unit offers numerous benefits for property management professionals. It plays a crucial role in accurate budget planning by providing historical data to forecast future maintenance expenses. By identifying units or systems consistently requiring high maintenance, managers can address underlying issues, improve preventative measures, and potentially reduce long-term costs. This KPI also serves as a valuable benchmark for operational efficiency, enabling comparisons against similar properties in the market. This comparative analysis can highlight areas for improvement and inform best practices. Furthermore, insights gleaned from this metric support strategic capital planning decisions. By understanding the lifecycle costs of various building systems, property managers can anticipate future capital expenditures and allocate resources effectively.
For example, a garden-style apartment complex maintaining an $800 per unit annual maintenance cost can compare this figure with industry benchmarks or similar properties to gauge its efficiency. A high-rise building successfully reducing its maintenance costs by 15% through a proactive preventative maintenance program demonstrates the tangible benefits of strategic maintenance management. Even an office building tracking $2.50 per square foot annual maintenance expense utilizes this KPI to optimize its operational budget and ensure tenant satisfaction.
However, it's important to be aware of the potential drawbacks and nuances of this KPI. Maintenance Cost Per Unit can vary significantly based on the age and condition of a property. Older buildings naturally require more extensive and frequent maintenance compared to newer constructions. Unexpected emergency repairs can also skew short-term data, making it essential to analyze long-term trends. Furthermore, this metric doesn't inherently account for deferred maintenance – postponing necessary repairs to reduce short-term costs. While tempting, deferred maintenance can lead to more significant and costly problems down the line. Finally, there's a risk that focusing solely on reducing this KPI can encourage under-maintenance, compromising the long-term integrity and value of the property.
To effectively leverage Maintenance Cost Per Unit as a property management key performance indicator, consider the following tips: implement robust preventative maintenance programs to minimize costly emergency repairs and extend the lifespan of building systems; track costs by specific categories (plumbing, electrical, HVAC) and individual systems to identify problem areas and optimize resource allocation; compare your Maintenance Cost Per Unit with similar aged properties in your market to benchmark your performance and identify best practices; and always strive to balance current maintenance costs with long-term asset preservation – prioritizing strategic investments that enhance property value and tenant satisfaction. Learn more about Maintenance Cost Per Unit. By diligently tracking and analyzing Maintenance Cost Per Unit, property managers can enhance operational efficiency, make informed financial decisions, and maximize the return on investment for their property portfolios.
8. Customer Satisfaction Score
Customer Satisfaction Score (CSAT) is a crucial property management key performance indicator (KPI) that gauges tenant happiness and contentment with their living experience or commercial space. In the competitive world of property management, understanding and actively improving tenant satisfaction is directly linked to profitability and long-term success. By measuring tenant satisfaction through surveys, online reviews, and feedback systems, property managers gain invaluable insights into what they’re doing well and where they need to improve. This KPI typically employs a numerical rating scale, such as 1-5 or 1-10, enabling property managers to track trends and quantify the overall sentiment of their tenant base. This qualitative metric provides a window into the tenant experience, predicts retention likelihood, and highlights areas for operational improvement, making it a cornerstone of effective property management.
For single-family property managers, understanding tenant satisfaction is paramount for maintaining positive landlord-tenant relationships and minimizing vacancy periods. Property management companies managing larger portfolios can leverage CSAT to identify systemic issues across properties and implement targeted improvements. Large rental portfolio owners benefit from understanding the overarching drivers of tenant satisfaction, which can inform investment decisions and strategic planning. Even tenant placement companies can use CSAT data to refine their placement strategies and ensure better tenant-property matches, leading to increased satisfaction and longer tenancies.
CSAT data is gathered through various channels, most commonly regular tenant surveys. These surveys can be conducted via email, online platforms, or even traditional paper methods. In addition to direct surveys, aggregating online reviews from platforms like Google My Business, Yelp, and apartment-specific review sites provides a broader perspective on tenant sentiment. Many organizations incorporate the Net Promoter Score (NPS) methodology within their CSAT framework. NPS asks tenants how likely they are to recommend the property to others, providing a simple yet powerful metric for gauging overall satisfaction and loyalty. These data collection efforts are typically conducted on a quarterly or annual basis, providing regular snapshots of tenant sentiment.
The benefits of tracking CSAT are numerous. High satisfaction scores directly correlate with improved tenant retention rates, reducing costly turnover and stabilizing occupancy. Satisfied tenants are also more likely to refer others, acting as organic brand ambassadors and reducing marketing expenses. Perhaps most importantly, CSAT surveys provide a direct line of communication with tenants, allowing property managers to proactively identify and address service improvement opportunities before they escalate into larger problems. Addressing these concerns fosters a positive property reputation, attracting and retaining high-quality tenants. This, in turn, can positively influence occupancy rates and potentially justify rent growth.
However, relying solely on CSAT comes with its challenges. Response rates to surveys can often be low, potentially skewing the data and creating selection bias. The subjective nature of satisfaction means that responses can vary based on individual tenant expectations, making comparisons challenging. While high CSAT scores are generally positive, it can be difficult to directly quantify the return on investment (ROI) of improvements made based on survey feedback.
Consider these real-world examples: An apartment community achieves a 4.2/5.0 average satisfaction score by implementing a responsive maintenance program that addresses tenant requests promptly and efficiently. An office building improves its NPS from +20 to +45 after upgrading common amenities and implementing tenant engagement initiatives. A student housing complex maintains an 85% satisfaction rate by organizing regular resident events and fostering a strong sense of community.
To maximize the effectiveness of CSAT as a property management KPI, implement these actionable tips:
- Survey tenants regularly and consistently: Establish a regular cadence for surveys, whether quarterly or annually, to track trends and identify emerging issues.
- Act on feedback promptly: Don't just collect data; actively address tenant concerns and implement improvements based on the feedback received.
- Track scores over time: Monitoring CSAT scores over time allows you to gauge the impact of implemented changes and identify areas needing further attention.
- Benchmark against competitor reviews: Compare your scores to those of similar properties in your market to identify areas where you excel and where you can improve.
Companies like Grace Hill (property management training), RentVoice (tenant feedback platform), SatisFacts (apartment industry surveys), and Kingsley Associates (commercial real estate surveys) have popularized the use of CSAT in the property management sector, providing tools and resources to help property managers effectively gather and analyze tenant feedback. By integrating CSAT into your KPI framework, you can gain a deeper understanding of tenant needs and preferences, improve operational efficiency, and ultimately enhance the profitability of your property management business.
Key Metrics Comparison of 8 Property Management KPIs
Leveraging KPIs for Property Management Excellence
By consistently monitoring and analyzing these eight property management key performance indicators—Occupancy Rate, Net Operating Income (NOI), Tenant Turnover Rate, Average Days to Lease, Operating Expense Ratio, Rent Collection Rate, Maintenance Cost Per Unit, and Customer Satisfaction Score—you gain a comprehensive understanding of your portfolio's performance. These KPIs illuminate areas ripe for improvement, empowering you to make data-driven decisions that boost profitability, streamline efficiency, and elevate tenant satisfaction. Just as financial institutions rely heavily on metrics to understand performance and manage risk, the property management sector can leverage similar principles. For a deeper dive into financial performance measurement, consider exploring how key performance indicators for banks are used to boost profits and mitigate risk, courtesy of Visbanking.
The most important takeaway is this: actively managing your property management key performance indicators is not merely a best practice; it's a necessity for thriving in today's competitive landscape. Mastering these concepts translates directly to increased revenue, reduced operational costs, and stronger tenant relationships. This ultimately contributes to the long-term health and stability of your property management business.
Embrace the power of data, and set your property management business up for lasting success in 2025 and beyond. Streamline your operations and boost those key performance indicators with Showdigs. Showdigs offers tools to automate tasks, improve communication, and enhance the tenant experience, directly impacting your bottom line.