
Unlocking Property Management Success with Data-Driven Insights
In property management, strong performance requires data-backed decisions. This listicle details seven key property management metrics to track in 2025 for optimal portfolio management. Understanding metrics like occupancy rate, tenant retention rate, net operating income (NOI), average days on market (DOM), maintenance response time, cost per unit (CPU), and lease renewal rate increase empowers informed decision-making and boosts profitability. By analyzing these property management metrics, you can identify areas for improvement, optimize performance, and achieve greater success.
1. Occupancy Rate
Occupancy rate is a fundamental property management metric that measures the percentage of rental units currently occupied compared to the total number of available units. This key performance indicator (KPI) directly reflects a property's revenue-generating capacity and provides crucial insights into market performance and the effectiveness of management strategies. Calculated by dividing the number of occupied units by the total number of units and then multiplying by 100, occupancy rate offers a clear snapshot of a property's leasing success. For example, a property with 90 occupied units out of 100 total units has a 90% occupancy rate.
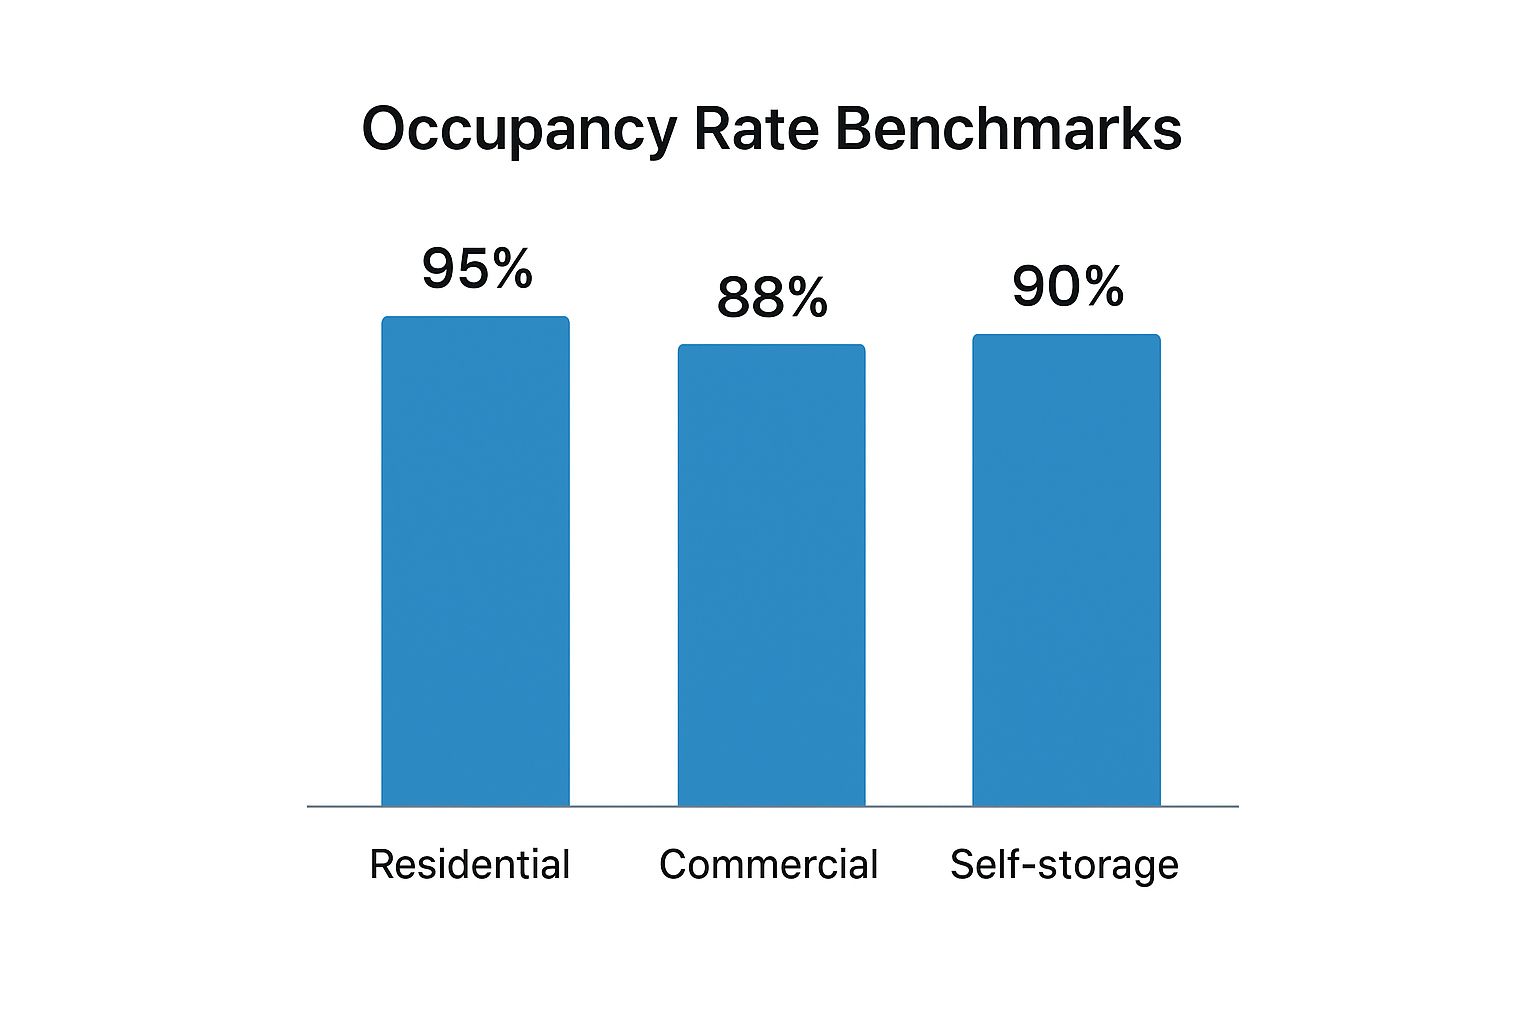
This infographic visualizes occupancy rate data across different property types. The bar chart clearly shows that Class A multifamily properties maintain the highest occupancy rates, followed by Class B, then Class C properties, and finally, single-family rentals. This suggests that higher-quality properties tend to attract and retain tenants more effectively. The visualization also underscores the importance of segmenting occupancy data by property type for a more accurate performance analysis.
Occupancy rate is typically tracked monthly or annually and can be further segmented by property type, location, or even unit size to provide a more granular view. Industry benchmarks for occupancy rates vary depending on the specific market and property type, making localized comparisons crucial. Leading property management companies like Equity Residential, known for maintaining occupancy rates around 96% across their multifamily portfolio, demonstrate the power of prioritizing this metric. Similarly, Camden Property Trust leverages occupancy rate trends to strategically adjust their marketing strategies seasonally, maximizing their revenue potential. Greystar, another industry leader, reports segmented occupancy metrics by property class to their investors quarterly, highlighting the transparency and importance of this data.
Features:
- Calculated as (Number of Occupied Units ÷ Total Number of Units) × 100
- Typically measured on a monthly or annual basis
- Can be segmented by property type, location, or unit size
- Industry benchmarks vary by market and property type
Pros:
- Simple to calculate and interpret
- Direct indicator of revenue potential
- Helps identify seasonal trends
- Benchmark for comparing performance against market averages
Cons:
- Doesn't account for rental rates or revenue optimization. A high occupancy rate doesn't necessarily translate to maximized profits.
- High occupancy might indicate underpriced units, leaving potential revenue on the table.
- Can mask turnover issues if only measured at specific points in time.
- Doesn't reflect tenant quality or lease terms.
Tips for Leveraging Occupancy Rate:
- Track occupancy rate alongside rental rates to ensure optimal revenue generation. Find the balance between maximizing occupancy and achieving competitive rental pricing.
- Compare your occupancy rate to local market averages rather than using absolute targets. Understand your property's performance relative to its direct competitors.
- Consider economic occupancy (actual revenue compared to potential revenue) alongside physical occupancy. This provides a more comprehensive picture of your financial performance.
- Monitor trends over time rather than isolated measurements. Identify patterns and seasonality to proactively adjust your management strategies.
Occupancy rate deserves a prominent place in any property management metrics analysis because it provides a foundational understanding of a property's performance. By tracking, analyzing, and acting upon occupancy rate data, property managers can make informed decisions to optimize their operations, attract and retain tenants, and ultimately maximize their revenue potential. For single-family property managers, large portfolio owners, and tenant placement companies alike, understanding and optimizing occupancy rate is crucial for long-term success in the competitive rental market.
2. Tenant Retention Rate
Tenant retention rate is a crucial property management metric that measures the percentage of tenants who choose to renew their leases after the initial term expires. This metric offers valuable insights into tenant satisfaction, the effectiveness of property management strategies, and the overall financial health of a property or portfolio. By understanding and actively managing tenant retention, property managers can significantly impact profitability and reduce operational costs. This metric deserves a prominent place in any property manager's toolkit because it directly correlates with long-term financial success and operational efficiency.

How It Works:
The tenant retention rate is calculated using a simple formula: (Number of Renewed Leases ÷ Total Number of Leases Eligible for Renewal) × 100. This calculation is typically performed annually or quarterly to track trends and identify areas for improvement. For a more granular analysis, retention rates can be further broken down by tenant demographics, unit types, or lease terms, providing a deeper understanding of tenant behavior and preferences. For example, are families with young children more likely to renew in properties with playgrounds? Are tenants in upgraded units demonstrating higher retention compared to those in standard units? These insights can inform targeted strategies to improve overall retention.
Features and Benefits:
- Reduced Turnover Costs: High retention rates directly translate to lower turnover costs, including marketing expenses, unit repairs, cleaning, and lost rent during vacancy periods.
- Stable Cash Flow: Predictable lease renewals contribute to a more stable and predictable cash flow, simplifying financial planning and investment decisions.
- Indicator of Property Management Effectiveness: Strong retention rates reflect positive tenant experiences and effective property management practices.
- Market Competitiveness: High retention can signify a competitive advantage in the market, attracting prospective tenants seeking stability and quality management.
Pros and Cons:
Pros:
- Reflects tenant satisfaction and property management quality.
- Reduces costly turnover expenses (marketing, repairs, lost rent).
- Provides stability in cash flow projections.
- Indicates market competitiveness of offering.
Cons:
- Doesn't distinguish between valuable and problematic tenants. High retention of difficult tenants can be detrimental.
- High retention can sometimes prevent necessary rent increases, impacting potential revenue growth.
- May mask property condition issues if tenants stay despite problems, delaying necessary repairs.
- Can be skewed by market conditions outside management control, such as limited housing availability.
Examples of Successful Implementation:
- Large property management companies like AvalonBay Communities have achieved impressive retention rates by focusing on tenant experience programs, demonstrating the direct link between tenant satisfaction and lease renewals.
- Essex Property Trust reported a 5% increase in tenant retention after implementing digital lease renewal systems, streamlining the process and enhancing tenant convenience.
- Invitation Homes, a major player in the single-family rental market, has achieved significant cost savings by prioritizing tenant retention, reducing turnover costs by millions.
Actionable Tips for Property Managers:
- Implement regular tenant satisfaction surveys to proactively identify areas for improvement and address tenant concerns before they escalate.
- Create tiered renewal incentives based on tenant payment history and lease duration, rewarding loyal tenants and encouraging continued tenancy.
- Thoroughly analyze reasons for non-renewals to identify and address any systematic issues contributing to tenant turnover. Exit interviews can be invaluable in gathering this information.
- Consider retention rates when evaluating property managers' performance, aligning incentives with the goal of maximizing tenant retention.
- Initiate renewal conversations with tenants at least 90 days before lease expiration, allowing ample time for negotiation and decision-making.
When and Why to Use This Metric:
Tenant retention rate should be a core metric tracked consistently by all property managers, regardless of portfolio size. It’s essential for evaluating the effectiveness of management strategies, identifying areas for improvement, and ultimately, driving profitability. Tracking this metric regularly allows property managers to:
- Benchmark performance against competitors: IREM and NAA research provide industry benchmarks, allowing property managers to assess their performance relative to others.
- Make data-driven decisions: Understanding retention trends can inform decisions related to rent adjustments, property improvements, and tenant services.
- Optimize resource allocation: Focus resources on strategies that demonstrably improve tenant retention and deliver the greatest return on investment.
By focusing on tenant retention, property managers can create a more stable and profitable business, fostering positive tenant relationships and maximizing the long-term value of their properties.
3. Net Operating Income (NOI)
Net Operating Income (NOI) is a crucial property management metric that reveals the profitability of a property. It represents the total revenue generated by the property after deducting all operating expenses, excluding mortgage payments (debt service), depreciation, and capital expenditures. NOI provides a clear picture of a property's financial performance based solely on its operational efficiency, making it a valuable tool for evaluating investment opportunities and comparing properties independent of their financing structures. For property managers, understanding and optimizing NOI is essential for maximizing returns for property owners and demonstrating effective management.

NOI is calculated by subtracting operating expenses from the gross operating income. Operating expenses include costs necessary to maintain and operate the property, such as property management fees, maintenance and repairs, property taxes, insurance, utilities, and marketing costs. For example, if a property generates $200,000 in annual gross operating income and has $80,000 in annual operating expenses, the NOI is $120,000. This metric can be measured monthly, quarterly, or annually, allowing for detailed tracking and analysis of performance trends. NOI is a fundamental component in calculating other key property management metrics like cap rate (Capitalization Rate) and cash-on-cash return, further solidifying its importance in investment analysis. Moreover, it's a key factor used by lenders in mortgage underwriting and serves as a basis for determining property value, particularly in commercial real estate.
Examples of Successful Implementation:
- Large Rental Portfolio Owners: A large portfolio owner can use NOI to compare the performance of different properties within their portfolio, identifying high-performing and underperforming assets. This allows for strategic decision-making regarding renovations, rent adjustments, or even property sales.
- Property Management Companies: Property management companies often use NOI as a key performance indicator (KPI) for their managers, incentivizing strategies to increase revenue (e.g., higher occupancy rates) and decrease operating expenses (e.g., negotiating better contracts with vendors).
- Tenant Placement Companies: By understanding the drivers of NOI, tenant placement companies can better match properties to investors looking for specific returns. This understanding allows for more effective marketing and quicker placements, ultimately benefiting both landlords and tenants.
Pros:
- Provides a clear and concise view of a property's operational performance.
- Allows for accurate comparisons between properties, regardless of financing.
- Simplifies investment analysis and valuation.
- Forms the basis for calculating important investment metrics.
Cons:
- Doesn't account for capital expenditures or debt service, which can significantly impact overall profitability.
- Can be manipulated by deferring necessary maintenance, artificially inflating short-term NOI.
- May not accurately reflect future performance if extraordinary income or expenses occurred during the measurement period.
- Requires standardized accounting practices for reliable comparisons across different properties.
Tips for Property Managers:
- Track NOI monthly and calculate rolling 12-month averages to identify trends and seasonality.
- Break down operating expenses by category to pinpoint areas for cost optimization.
- Benchmark NOI margins against comparable properties in your market to assess competitiveness.
- Create NOI forecasts that consider lease expirations, market conditions, and potential capital improvements.
- Develop proactive strategies to increase NOI through both revenue growth (rent increases, improved occupancy) and expense reduction (negotiating lower costs, energy efficiency initiatives).
NOI's widespread use, from individual investors to large Real Estate Investment Trusts (REITs), demonstrates its importance as a cornerstone of property management and investment analysis. By understanding and actively managing NOI, property managers can enhance property value, maximize returns for owners, and make informed decisions that drive long-term success.
4. Average Days on Market (DOM)
Average Days on Market (DOM) is a crucial property management metric that measures the average time it takes to lease a vacant unit, from the moment it's listed to when a lease is signed. This key performance indicator (KPI) offers valuable insights into the effectiveness of your marketing strategies, the competitiveness of your pricing, and the overall desirability of your properties. Tracking DOM is essential for optimizing your operations, minimizing vacancy loss, and maximizing revenue. Therefore, it deserves a prominent place in any property manager's toolkit of property management metrics.
How It Works:
DOM is calculated by dividing the total number of days all vacant units were on the market by the number of units leased during a specific period. This period is typically measured monthly or quarterly, taking into account seasonal variations in rental demand. For a more granular analysis, DOM can be segmented by unit type (e.g., studio, 1-bedroom), size, or price point, providing a more nuanced understanding of market dynamics.
Why Use DOM?
DOM provides a clear picture of market demand and the competitiveness of your rental pricing. A low DOM typically signifies high demand and effective property management, while a high DOM might suggest the need for adjustments in marketing, pricing, or property improvements. By monitoring DOM, you can:
- Optimize Marketing Spend: Identify which marketing channels are driving the fastest lease-ups and allocate your budget accordingly.
- Identify Property Issues: A consistently high DOM for a particular unit or property might indicate underlying issues with the property's condition, amenities, or location.
- Benchmark Performance: Compare your DOM against local market averages to assess your performance and identify areas for improvement.
- Minimize Vacancy Loss: By streamlining the leasing process and reducing DOM, you directly minimize vacancy periods and maximize rental income.
Features and Benefits:
- Directly Impacts Financials: DOM has a direct impact on vacancy loss and marketing expenses.
- Segmented Analysis: Analyze DOM by various factors (unit type, size, price) to identify specific areas for improvement.
- Market Insight: Gain a deeper understanding of market demand and pricing trends.
Pros:
- Indicates market demand and pricing competitiveness.
- Helps optimize marketing budget allocation.
- Identifies potential issues with property condition or amenities.
- Allows performance benchmarking against market averages.
Cons:
- Can be skewed by outlier units with extremely long or short marketing periods.
- Market seasonality can impact interpretation if not properly contextualized.
- Doesn't account for the quality of tenants secured.
- May not reflect true demand if the pricing strategy is significantly below market.
Examples of Successful Implementation:
- Lincoln Property Company: Reduced average DOM from 45 to 28 days by implementing virtual tours.
- Mid-America Apartment Communities: Uses DOM by floor plan to adjust pricing models.
- Cortland: Adjusts marketing channels based on DOM performance metrics.
Actionable Tips for Property Managers:
- Break down DOM by marketing channel: Identify the most effective platforms and optimize your spending.
- Set DOM targets based on local market conditions: Avoid using national averages, as local markets can vary significantly.
- Consider pricing adjustments if DOM exceeds 30 days in active markets: This could signal that your pricing is too high.
- Analyze the correlation between DOM and eventual lease performance: A shorter DOM doesn't always equate to a better tenant.
- Track DOM alongside cost per lease acquisition: This provides a complete picture of your marketing ROI.
This metric is particularly relevant for Single-Family Property Managers, Property Management Companies, Large Rental Portfolio Owners, and Tenant placement companies as it provides a direct measure of efficiency and market responsiveness. By diligently tracking and analyzing DOM, these professionals can optimize their operations, improve profitability, and stay ahead of the competition in a dynamic rental market.
5. Maintenance Response Time
Maintenance Response Time is a crucial property management metric that measures the efficiency and effectiveness of a property's maintenance operations. It tracks the duration between a tenant submitting a maintenance request and the completion of the required repair or service. This property management metric provides valuable insights into tenant satisfaction, property upkeep, and overall operational efficiency. Analyzing and optimizing Maintenance Response Time is key for any property manager aiming to enhance their performance and retain tenants.
This metric encompasses the entire timeline, from the moment a tenant logs a maintenance issue (whether through an online portal, phone call, or email) to the final completion and closure of the work order. By monitoring this timeframe, property managers can identify bottlenecks, improve processes, and ultimately deliver a better living experience for their tenants.
Features and Functionality:
- Prioritization: Maintenance requests are typically categorized by priority levels. These often include "Emergency" (requiring immediate attention, such as burst pipes or fire hazards), "Urgent" (requiring prompt action, such as a broken heating system in winter), and "Routine" (less time-sensitive issues, like a dripping faucet). This categorization allows maintenance teams to allocate resources effectively.
- Measurement: Emergency issues are generally measured in hours, while non-emergency requests are tracked in days. Both the initial response time (time to acknowledge the request and schedule a visit) and the complete resolution time (time to fully address the issue) are vital components of this metric.
- Integration: Many modern property management software solutions offer integrated maintenance tracking features, automating the process from request submission to work order completion and facilitating data analysis.
Pros:
- Tenant Satisfaction and Retention: A prompt and effective response to maintenance issues significantly impacts tenant satisfaction and encourages lease renewals.
- Preventive Maintenance: Addressing minor issues quickly prevents them from escalating into costly major repairs, preserving the property's value.
- Accountability: Tracking response time promotes accountability for both in-house maintenance staff and external vendors.
- Systemic Issue Identification: Recurring maintenance requests for specific issues can highlight underlying property problems that require capital improvements.
Cons:
- Premature Closure: Focusing solely on speed can incentivize closing tickets prematurely without ensuring proper resolution, leading to recurring problems and tenant dissatisfaction.
- Priority Definition: The effectiveness of this metric hinges on a clear and consistent definition of priority levels. Ambiguity can lead to misallocation of resources and delays.
- Quality of Repairs: Maintenance Response Time doesn't inherently reflect the quality of the repairs performed. Additional quality checks are necessary to ensure lasting solutions.
- Seasonal Adjustments: Workload fluctuations due to seasonal factors (e.g., increased heating issues in winter) may necessitate adjustments to evaluation criteria to ensure fair assessment of staff performance.
Examples of Successful Implementation:
- Pinnacle Property Management boasts a 98% same-day response rate for emergency requests across their extensive portfolio of 172,000 units, demonstrating the potential for scale and efficiency.
- FirstService Residential successfully reduced their average response time from 72 hours to 24 hours by implementing a mobile work order system, highlighting the benefits of technological integration.
- BH Management Services leverages their impressive 4-hour average response time as a key differentiator in their marketing materials, recognizing the value of this metric for attracting and retaining tenants.
Actionable Tips:
- Service Level Agreements (SLAs): Establish clear SLAs for different request types, outlining expected response and resolution times.
- Tenant Communication: Implement a robust communication system to provide tenants with regular updates on the status of their maintenance requests.
- Track Alongside Satisfaction: Monitor Maintenance Response Time in conjunction with tenant satisfaction scores to identify correlations and areas for improvement.
- Preventive Maintenance: Invest in preventive maintenance programs to minimize the occurrence of emergency requests and improve long-term property health.
- Quality Control: Integrate quality checks into the maintenance process to ensure first-time resolution and minimize repeat visits.
Why Maintenance Response Time Matters:
In the competitive landscape of property management, Maintenance Response Time serves as a key performance indicator and a powerful differentiator. It directly impacts tenant satisfaction, property value, and operational efficiency. By prioritizing and optimizing this metric, property managers can demonstrate their commitment to tenant well-being, reduce operational costs, and enhance their reputation in the market. This is why it deserves a prominent place in any property management metrics analysis. Effective tracking and management of Maintenance Response Time ultimately contributes to a more successful and profitable property management operation.
6. Cost Per Unit (CPU)
Cost Per Unit (CPU) is a crucial property management metric that provides a clear picture of the average operating expense for each rental unit within a given period. This metric helps property managers, from those handling single-family homes to those overseeing large portfolios, understand expense patterns, create realistic budgets, and benchmark their operational efficiency against industry standards and competitors. By analyzing CPU, you gain data-driven insights that inform resource allocation and expense management strategies, ultimately impacting your bottom line. This makes CPU a vital metric for any property manager looking to optimize their financial performance.
How CPU Works:
CPU is calculated by dividing the total operating expenses by the number of units. This straightforward calculation offers a powerful tool for assessing profitability and efficiency.
- Formula: Total Operating Expenses ÷ Number of Units
The calculation is typically performed monthly, quarterly, and annually, enabling you to track trends and identify seasonal variations. To gain a more granular understanding, CPU can be further broken down by expense categories such as maintenance, utilities, administrative costs, marketing, and insurance. For a comprehensive financial analysis, CPU should always be evaluated in conjunction with revenue metrics like effective gross income and net operating income. Furthermore, normalizing CPU by square footage allows for meaningful comparisons between properties with varying unit sizes and different property types.
Why Use CPU?
CPU offers several key benefits for property management professionals:
- Benchmarking Operational Efficiency: CPU provides a clear benchmark to compare your property's performance against similar properties in the market, identifying areas for potential improvement.
- Identifying Cost Reduction Opportunities: By analyzing CPU trends and breakdowns, you can pinpoint expense anomalies and uncover opportunities to reduce costs without sacrificing quality.
- Accurate Budgeting and Forecasting: Historical CPU data informs future budget planning and expense forecasting, enabling you to make more informed financial decisions.
- Inter-Property Comparison: CPU facilitates meaningful comparisons between properties of similar class, age, and location, allowing you to assess the effectiveness of different management strategies.
Pros and Cons of Using CPU:
Pros:
- Provides a clear benchmark for operational efficiency.
- Helps identify expense anomalies and opportunities for cost reduction.
- Facilitates accurate budgeting and expense forecasting.
- Allows for meaningful comparison between properties of similar class.
Cons:
- Raw CPU numbers can be misleading without context of property class, location, and market conditions.
- A lower CPU isn't always better if it compromises property condition or resident satisfaction.
- Fixed costs can disproportionately skew CPU metrics for smaller properties.
- Doesn't inherently account for varying unit sizes within a property, necessitating normalization by square footage for accurate comparison.
Examples of Successful Implementation:
Large property management companies demonstrate the practical value of CPU analysis:
- AvalonBay Communities: Reduced CPU by 7% through targeted energy efficiency initiatives across their portfolio.
- Camden Property Trust: Benchmarks CPU by region and property age to set realistic performance targets and identify areas needing attention.
- Equity Residential: Uses CPU variance analysis to evaluate management effectiveness across different properties and identify best practices.
Actionable Tips for Using CPU:
- Break down CPU: Categorize expenses into controllable (e.g., landscaping) and non-controllable (e.g., property taxes) to focus cost-saving efforts effectively.
- Track trends: Analyze CPU trends over time, rather than relying on isolated data points, to identify meaningful changes and patterns.
- Benchmark strategically: Compare your CPU against comparable properties with similar age, class, and location to gain relevant insights.
- Balance cost and quality: Analyze CPU alongside tenant satisfaction metrics to ensure cost-cutting measures don't negatively impact resident experience.
- Account for seasonality: Consider seasonal adjustments when evaluating monthly CPU performance, as expenses like heating and cooling can fluctuate significantly.
By diligently tracking and analyzing Cost Per Unit, property managers can gain valuable insights into their operational efficiency, identify cost-saving opportunities, and make data-driven decisions that contribute to a healthier bottom line. Whether you manage a single-family home or a sprawling apartment complex, CPU is a fundamental metric that should be a cornerstone of your financial management strategy.
7. Lease Renewal Rate Increase
Lease Renewal Rate Increase is a crucial property management metric that measures the percentage increase in rent when a tenant renews their lease. This metric offers valuable insights into your pricing power, management effectiveness, and overall portfolio performance, making it essential for optimizing revenue and long-term growth. It's a key component of successful property management, directly impacting your bottom line and deserving its place among essential property management metrics.
How it Works:
The Lease Renewal Rate Increase is calculated using a simple formula:
((New Lease Rate - Previous Lease Rate) ÷ Previous Lease Rate) × 100
This percentage represents the increase applied to the previous rent. Typically measured annually and compared against current market rate increases, this metric can be further segmented by tenant longevity, unit type, and property location for a more granular analysis. This detailed view allows property managers to tailor their renewal strategies for optimal performance across their portfolio.
Why Use Lease Renewal Rate Increase?
This metric is particularly valuable for stabilized properties, as it represents a significant revenue growth driver without the costs associated with acquiring new tenants. Successfully increasing renewal rates contributes directly to net operating income (NOI) and property value appreciation. It also serves as an indicator of market strength and your ability to command higher rents. The compounding effect of even modest annual increases generates substantial long-term value.
Benefits and Features:
- Critical Revenue Driver: Increases revenue from existing tenants, maximizing income potential from stabilized assets.
- Cost-Effective Growth: Less expensive than marketing, tenant screening, and unit turnover costs associated with new tenants.
- Market Indicator: Reflects market conditions and your property's competitive positioning.
- Long-Term Value Creation: Compounding increases contribute significantly to long-term property value appreciation.
- Segmented Analysis: Allows for tailored strategies based on tenant history, unit type, and location.
Pros and Cons:
Pros:
- Critical revenue growth driver for existing properties
- Less costly than achieving growth through new tenant acquisition
- Indicates market strength and pricing power
- Compound effect creates significant long-term value
Cons:
- Too aggressive increases can reduce tenant retention rates
- May be constrained by rent control or other regulations
- Market downturns can make increases difficult to achieve
- Doesn't account for concessions or other lease terms
Examples of Successful Implementation:
- Essex Property Trust: Achieved an average of 3.8% renewal increases while maintaining a 60% retention rate, demonstrating a balance between revenue growth and tenant satisfaction.
- UDR: Implements a value-based pricing model, showing tenants market comparisons to justify increases and promote transparency.
- Mid-America Apartment Communities: Uses a tiered renewal pricing strategy based on payment history, rewarding reliable tenants with potentially lower increases.
Actionable Tips:
- Develop a Renewal Pricing Matrix: Base your pricing strategy on current market conditions, tenant payment history, and property upgrades.
- Early Engagement: Initiate renewal conversations 90-120 days before lease expiration to give tenants ample time to consider their options.
- Multi-Year Leases: Offer multi-year leases with predetermined increases for income stability and tenant retention.
- Strategic Property Improvements: Time property improvements to coincide with renewal cycles to justify rent increases.
- Track Acceptance Rates: Monitor renewal increase acceptance rates to identify optimal pricing points and adjust your strategy accordingly.
Popularized By:
Leading property management software providers like RealPage and Yardi have incorporated sophisticated revenue management tools and algorithms (like RENTmaximizer) to optimize renewal pricing. Industry associations such as the National Apartment Association also provide lease optimization frameworks and best practices.
By focusing on Lease Renewal Rate Increase as a key property management metric, property owners and managers can effectively drive revenue growth, enhance property value, and optimize their portfolio performance. Using data-driven strategies and understanding market dynamics are crucial for achieving success in this area.
7 Key Property Management Metrics Comparison
Optimizing Your Property Portfolio with Actionable Metrics
By consistently tracking and analyzing key property management metrics like occupancy rate, tenant retention rate, net operating income (NOI), average days on market (DOM), maintenance response time, cost per unit (CPU), and lease renewal rate increase, you gain a comprehensive understanding of your portfolio's performance. These metrics empower you to pinpoint areas for improvement, optimize strategies, and ultimately boost profitability. Mastering these concepts is essential for any property manager, owner, or tenant placement company looking to thrive in the competitive rental market.
The most important takeaway is that data-driven decision-making is no longer optional—it's a necessity. Understanding your NOI helps you assess overall profitability, while metrics like DOM and tenant retention rate offer insights into operational efficiency. To ensure your property management metrics are driving real results, it's crucial to regularly evaluate and measure your standard operating procedures (SOPs). For guidance on this, check out this resource on how to measure SOP effectiveness from Whale. By refining your processes and leveraging data, you can maximize returns and build a more resilient and profitable portfolio.
In today's dynamic market, leveraging technology is key to staying ahead. Tools like Showdigs can automate many of these tracking processes, seamlessly integrating with your existing property management software. This streamlines your operations, freeing up your time to focus on strategic growth initiatives and build lasting success in 2025 and beyond. Ready to transform your property management with data-driven insights? Explore how Showdigs can help you unlock the full potential of your property management metrics and elevate your business.