


Calculating the capitalization rate is simple on the surface: divide a property's Net Operating Income (NOI) by its current market value. But for property managers overseeing hundreds or thousands of units, mastering this formula is a critical component of portfolio optimization. It's the quickest, most powerful health check for asset performance and a key driver of strategic financial decisions.
Why Cap Rate Is a Critical Metric for Large-Scale Portfolio Management

When you're managing a distributed portfolio, the cap rate isn't just simple math. It becomes a core Key Performance Indicator (KPI) that drives your entire asset strategy. This is the one metric that cuts through the noise, giving you a standardized way to compare assets across different markets, property types (from SFR to multifamily), and even acquisition dates.
For tech-forward operations teams, think of it as the common language of real estate investment performance. A high cap rate might flag an underperforming asset with significant operational upside—a prime candidate for process improvements that can boost NOI. Conversely, a low cap rate often points to a stable, premium asset with lower perceived risk, but potentially less room for growth. Every cap rate tells a story about risk, return, and operational efficiency.
Benchmarking and Performance Analysis at Scale
One of the most immediate, practical uses for cap rate is performance benchmarking across a large portfolio. Once you calculate the cap rate for every property under your management, you can instantly see which assets are pulling their weight and which are lagging. This data-driven clarity allows for smarter, more scalable capital allocation and operational focus.
Let's look at a straightforward example. If an asset in your portfolio generates an annual NOI of $80,000 and its current market value is $1,000,000, its cap rate is a solid 8%. Now, if you know the market average for similar properties in that submarket is hovering around 6-7%, you’ve just confirmed you have a strong performer. This insight is crucial when managing hundreds of assets, as it helps prioritize your team's efforts.
This analysis lets you:
- Spot Underperforming Assets: Pinpoint properties with unusually low cap rates compared to their peers, flagging them for an operational deep dive. Is the issue high vacancy rates, excessive maintenance costs, or below-market rents?
- Validate Your Winners: Confirm which assets are delivering superior returns. You can then analyze their operational model—from leasing speed to maintenance efficiency—to replicate those strategies across other properties.
- Allocate Capital Smartly: Decide where to invest in property improvements that will directly boost NOI and, in turn, the property’s overall value and cap rate.
Cap Rate Calculation at a Glance
This table summarizes the core components needed to calculate the capitalization rate for any property in your portfolio. Standardizing this calculation is key to accurate multi-market analysis.
With these figures in hand, you have everything you need to start comparing apples to apples across your entire portfolio.
Driving Strategic Buy/Sell Decisions
Beyond daily operations, cap rate is a huge driver of high-level strategy—namely, when to acquire and when to dispose of an asset. When evaluating a potential acquisition, its "going-in" cap rate gives you an immediate feel for its potential return relative to the asking price and market benchmarks.
Likewise, if you're considering selling an asset, knowing its current cap rate helps you set a realistic valuation and position it correctly in the market. This metric is also closely tied to the physical state of the property; a well-maintained asset with excellent records can justify a lower, more attractive cap rate to potential buyers. In fact, there's a direct link between thorough reporting and asset value, which we cover in our guide on the importance of property condition reports.
By regularly calculating and analyzing cap rates across your entire portfolio, you shift from reactive management to proactive, data-informed strategy. It’s how you transform raw operational data into actionable intelligence that drives growth, optimizes revenue, and delivers superior investor returns.
Getting Your Net Operating Income Right
Your cap rate is only as good as the numbers you feed it. Get the Net Operating Income (NOI) wrong, and you're setting yourself up for flawed analysis and bad strategic calls. For any property management company managing a large portfolio, standardizing this calculation is non-negotiable. It's the only way to make true apples-to-apples comparisons across different markets and asset types.
Everything starts with Gross Potential Rent (GPR). Think of this as your property's absolute best-case scenario—what you’d make if every unit was rented at full market value for the entire year, with zero vacancies. It’s a useful, if theoretical, ceiling.
But reality always bites. No property hits 100% occupancy with perfect rent collection. That's why we immediately adjust GPR down to a more realistic figure: Effective Gross Income (EGI). To get there, you simply subtract your losses from vacancies and credit issues (unpaid rent). For large portfolios, even a small reduction in vacancy through faster leasing can have a massive impact on EGI.
From Gross Income to Net Income
With your EGI in hand, it's time to subtract all the legitimate operating expenses—the real costs of keeping the property running smoothly. Consistency is everything here, especially when you're comparing properties across a portfolio. A standardized chart of accounts is your best friend, ensuring every property manager is categorizing expenses the same way.
So, what gets deducted? These are the usual suspects:
- Property Taxes: Your annual bill from the city or county.
- Property Insurance: Essential coverage for liability and property damage.
- Utilities: Any costs not passed on to tenants, like water for common areas, trash, or landscaping irrigation.
- Repairs & Maintenance: The budget for routine upkeep—everything from landscaping and pest control to fixing leaky faucets and patching drywall.
- Property Management Fees: The fee paid to your firm or a third-party manager for overseeing the asset.
To accurately calculate Net Operating Income (NOI), you have to get a handle on all relevant expenses, including taxes. While rules differ everywhere, you can get a glimpse of how these are treated by understanding Netherlands rental income tax as one example of international practices.
What NOT to Include in Operating Expenses
Knowing what to leave out is just as critical as knowing what to put in. This is where many operators trip up, completely skewing their cap rate. These items are not operating expenses and must be kept out of your NOI calculation.
Key Insight for Large Portfolios: NOI is designed to measure a property's inherent profitability, independent of its financing structure or ownership-specific tax situations. Including debt service or capital expenditures in the calculation defeats this purpose and makes it impossible to accurately benchmark properties at scale.
Make sure you're not deducting these costs:
- Debt Service: Mortgage payments—both principal and interest—are out. The owner's financing deal is unique to them and irrelevant to the property's operational performance.
- Capital Expenditures (CapEx): These are the big-ticket items that extend a property's life, like a new roof or a full HVAC replacement. They are capital costs, not day-to-day operating expenses.
- Depreciation: This is a non-cash expense for tax purposes. It has no place in a cash-flow-focused calculation like NOI.
- Income Taxes: Corporate or personal income taxes are tied to the owner, not the asset itself.
By carefully including only true operating expenses and keeping these other costs separate, you'll arrive at a clean, accurate NOI. This number is the bedrock of a reliable cap rate—one you can use with confidence to benchmark properties, spot opportunities, and make sharp investment decisions.
A Practical Cap Rate Calculation Walkthrough
Enough with the theory—let's apply it. The real power of cap rate comes alive when you apply it to an actual property. This is where you move from abstract concepts to the concrete, data-driven decisions that shape your entire portfolio strategy.
Think of this as your repeatable framework for sizing up any asset, whether it's a new acquisition target or an existing property in your portfolio.
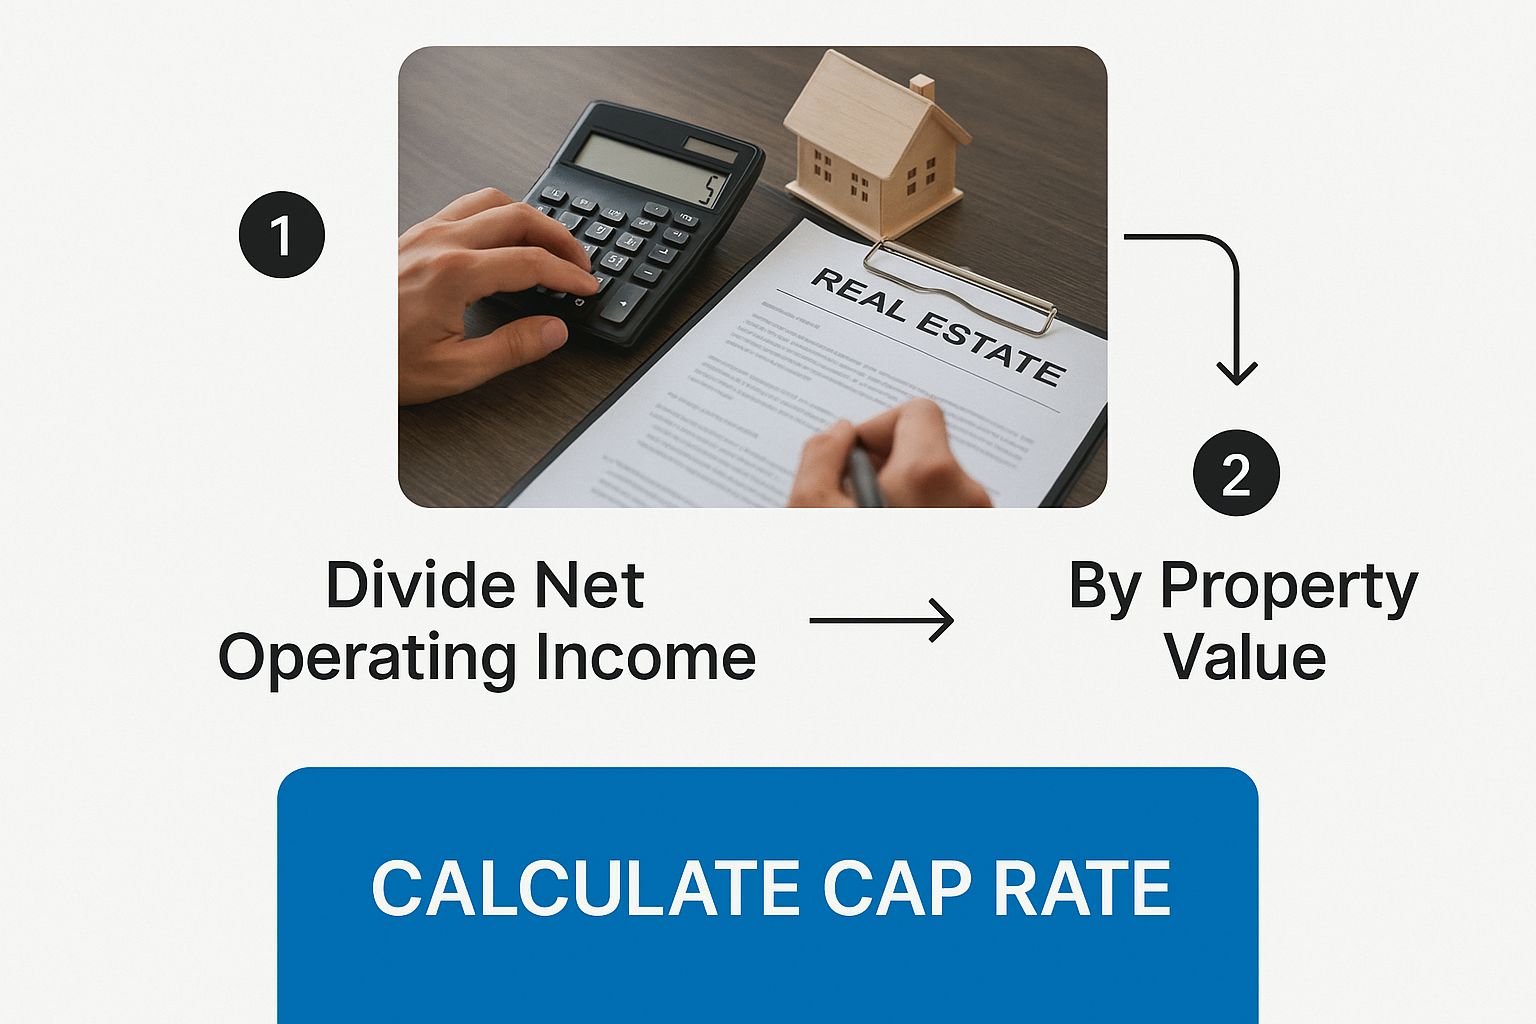
As the visual above shows, calculating cap rate isn't some mystical financial art. It's a straightforward process that starts with real numbers from your own operating statements and property management software.
Multifamily Property Example
Let's put this into practice with a 50-unit multifamily building. Our goal is simple: calculate its current cap rate based on its financial performance and what it's worth today.
First, we need to nail down the income.
- Gross Potential Rent (GPR): Each of the 50 units brings in $1,500 a month. That gives us an annual GPR of $900,000 (50 units x $1,500/mo x 12 mo).
- Vacancy & Credit Loss: No property is 100% full all the time. Let's say this one historically runs a 5% vacancy and credit loss rate. That's a $45,000 reality check we need to subtract. For a portfolio of this size, reducing that vacancy rate by just 1% (to 4%) through faster leasing would add $9,000 directly to the NOI.
- Effective Gross Income (EGI): After accounting for vacancy, our realistic income, or EGI, is $855,000.
Next up, the expenses. We need to tally every single operational cost for the year.
- Property Taxes: $75,000
- Insurance: $25,000
- Utilities (owner-paid): $30,000
- Repairs & Maintenance: $50,000
- Management Fees (5% of EGI): $42,750
- Total Operating Expenses: $222,750
With our income and expenses locked in, we can find the Net Operating Income (NOI).
$855,000 (EGI) - $222,750 (OpEx) = $632,250 (NOI)
Finally, we need the property's value. Based on recent sales of similar buildings in the area, we can estimate its current market value at $10,500,000.
Now for the final calculation:
Cap Rate = NOI / Market Value
Cap Rate = $632,250 / $10,500,000 = 0.0602 or 6.02%
There it is. A 6.02% cap rate. This single number is your benchmark. You can now compare this property's performance against others in your portfolio or any new deal you're considering.
Working Backwards from a Target Cap Rate
The formula is just as powerful when you flip it around. Let's say you're looking to acquire a new property. You've done your due diligence and found its NOI is a solid $400,000. You also know that similar assets in this specific submarket are trading at a 5.5% cap rate.
Instead of guessing what to offer, you can calculate a fair market value on the spot. If you want a deeper dive into the math, there's a great resource on understanding the Capitalization Rate Formula.
Market Value = NOI / Market Cap Rate
Market Value = $400,000 / 0.055 = $7,272,727
If the seller is asking for $8 million, your quick calculation tells you they're overpriced for this market. This gives you immediate leverage to negotiate from a data-backed position or the confidence to walk away and focus on better opportunities.
This dual approach—calculating a current cap rate and determining value from a target cap rate—is a fundamental toolkit for large-scale operators. It empowers you to quickly assess asset performance, identify acquisition targets, and negotiate from a position of data-backed confidence.
What a Good Cap Rate Actually Looks Like
One of the first questions from property managers and investors is, "So, what's a good cap rate?" The only accurate answer is: it depends.
A "good" cap rate isn't a universal number. It's a direct reflection of risk, opportunity, and the unique pulse of a specific market. For anyone managing a portfolio across different cities—or even just different submarkets—understanding this context is crucial for effective decision-making.
Think of a cap rate as a simple expression of risk versus return. There’s an inverse relationship you absolutely need to understand:
- Lower Cap Rates (e.g., 4-6%) almost always signal lower risk. You'll find these in prime, high-demand areas with high-credit tenants and newer, well-maintained properties (think Class A). Investors are willing to pay a premium for that stability, which pushes property values up and, consequently, cap rates down.
- Higher Cap Rates (e.g., 8-10%+) usually point to higher risk, but also greater potential for operational upside. These are common for properties in secondary/tertiary markets, older buildings needing renovations (Class B/C assets), or areas with higher vacancy rates. That higher rate is the reward investors expect for taking on more uncertainty and operational challenges.
The Cap Rate Risk and Return Spectrum
To bring this to life, let's look at how these ranges play out in the real world. This comparison is a huge help for managers who are trying to benchmark assets in completely different regions.
Seeing it laid out like this makes it clear: you're always trading security for potential upside, and vice versa.
Local Context Is Everything
Relying on a national average cap rate for portfolio analysis is a common but critical mistake. A 7% cap rate might be an absolute steal for an apartment building in a major coastal city, but it could be a massive red flag for a similar property in a smaller market.
For property managers juggling multi-market portfolios, the only comparison that matters is against local, asset-class-specific "comps." Your primary job is to determine if a property’s cap rate is in line with, better than, or worse than similar properties in its immediate submarket.
An unusually high cap rate for a particular market can signal a golden opportunity—an under-managed asset with huge potential. By reducing vacancy through faster leasing, bringing rents up to market rates, or trimming unnecessary expenses, you can give that NOI a serious boost and create significant value. Digging into these 8 ways to boost portfolio ROI can offer actionable ideas for turning those high-cap-rate properties into top performers.
Conversely, a cap rate that's too low compared to local comps could mean the property isn't performing at its peak and you're leaving money on the table.
Common Cap Rate Pitfalls to Avoid
The cap rate formula looks deceptively simple. In reality, this simplicity hides common traps that can lead to flawed analysis and costly mistakes across a large portfolio.
For managers juggling hundreds or thousands of units, a small miscalculation gets magnified into a huge strategic blunder. Getting the cap rate right isn't just an exercise—it's the bedrock of sound investment strategy at scale.
Don't Fall for "Pro Forma" Fantasies
One of the most frequent—and dangerous—mistakes is relying on "pro forma" NOI. This is the seller's optimistic projection of what a property could earn with perfect occupancy, immediate rent bumps, and magical expense reductions. It's a best-case scenario that rarely pans out.
To get a true feel for a property's performance, ground your analysis in the actuals. Use the trailing 12-24 months of operating statements (the "T12"). What did the property really bring in? What did it really cost to run? That is your only reliable starting point.
Forgetting About Future Capital Needs
Another classic mistake is ignoring future Capital Expenditures (CapEx). The standard NOI calculation doesn't include CapEx, which is technically correct, but no savvy operator ever overlooks it. A property might flash a tempting 8% cap rate today, but if you know it needs a $500,000 roof replacement in two years, that "return" is pure fiction.
Smart portfolio managers know to look past the initial cap rate and analyze the property's real financial health. Always build a replacement reserve budget for the big-ticket items you know are coming:
- HVAC system overhauls
- Roofing and major structural repairs
- Parking lot repaving
- A wave of appliance upgrades across units
If you ignore these inevitable costs, you're getting a distorted view of the asset's long-term profitability and its future demands on your cash flow.
Key Takeaway: An attractive cap rate means nothing if it's propped up by deferred maintenance. A real operational analysis must include a forward-looking CapEx budget to see the true cost of ownership.
Using Outdated or Irrelevant Comps
Finally, a cap rate is only as useful as the market data you compare it against. Using stale comps or applying a national average to a local asset is a recipe for a bad decision. Real estate is hyper-local. Market conditions can shift rapidly based on the economy, interest rates, or local development.
For instance, the entire commercial real estate world has felt cap rates adjust due to changing financial conditions. One study of the hotel sector found that cap rates calculated using the "band-of-investment" technique shot up by about 170 basis points (1.7%) post-pandemic. This highlights just how sensitive valuations are to the cost of capital. You can dive deeper into how financial conditions impact cap rates in this analysis.
This proves why using sales data from six months ago—or from a submarket two towns over—can lead you completely astray. Your analysis must be rooted in fresh, relevant sales data from similar properties in the immediate area. Anything less is just guessing.
Frequently Asked Questions About Cap Rates

Let's wrap up by tackling some of the questions that always pop up when property managers and investors start digging into cap rates. Getting these common points of confusion cleared up will help you use this metric with much more confidence in your day-to-day decisions.
Can I Use the Purchase Price to Calculate a Cap Rate?
Absolutely. Using the purchase price is how you calculate a "going-in" cap rate. This is your baseline, the number that tells you what your projected return will be from day one of owning the property. It’s essential for evaluating a potential acquisition.
For ongoing portfolio management of assets you already own, you should use the current market value. This provides a live, accurate picture of how that asset is performing right now, relative to what it's worth today. It's the only way to spot which properties are true winners and which might be underperforming in the current market.
Where Do I Find Reliable Market Cap Rates?
Finding good, localized cap rate data is key to making sure your comparisons are meaningful. For large-scale operators, a multi-pronged approach is best:
- Commercial Real Estate Brokers: There's no substitute for relationships with brokers who are active in your specific markets and property types. They have the real-time scoop on what properties are actually trading for.
- Comparable Sales (Comps): Dig into recent sales of similar properties in the area. You can back into their cap rates by dividing their reported NOI by the final sale price.
- Industry Reports & Analytics: For a broader view, subscriptions to data platforms like CoStar, Real Capital Analytics, or reports from major firms like CBRE and JLL can give you solid, aggregated market data.
My advice? Never rely on just one source. The more data points you can triangulate, the more accurate your benchmark will be.
Does the Cap Rate Include Debt or Financing?
Nope, and this is a critical distinction. The cap rate formula intentionally excludes debt service—your mortgage payments. Think of it as measuring the property's raw, unlevered return, as if you bought it with all cash.
This is done by design. It lets you make a true apples-to-apples comparison between two properties, regardless of how the current owners decided to finance them. It isolates the performance of the asset itself from the owner's financial strategy.
It's a common misconception that cap rates move in lockstep with interest rates. Research from 1983 to 2013 actually showed that the link between U.S. Treasury yields and cap rates fluctuated wildly. It’s a great reminder that property valuations are driven by much more than just the cost of borrowing.
How Often Should I Recalculate Portfolio Cap Rates?
For active property management at scale, you should be recalculating your portfolio's cap rates at least annually. This cadence ensures you are working with fresh data to make smart, strategic moves related to capital allocation and asset disposition.
Of course, you'll also want to run the numbers anytime a major event happens: a major tenant leaving, a sudden spike in operating costs, or a significant shift in your local market's values. Staying on top of these metrics is just part of the continuous learning that separates good operators from great ones. If you're looking to keep learning, this list of the 22 best real estate books is a great place to find more industry wisdom.
At Showdigs, we know that operational metrics—from Days on Market (DOM) to lead-to-tour conversion rates—directly impact your portfolio's financial health and NOI. Our leasing automation platform is built to boost your bottom line by filling vacancies faster, cutting costly vacancy days, and freeing up your team to focus on high-value tasks. By automating lead responses and providing on-demand showing agents, we help large portfolios turn leads into leases with unparalleled speed and efficiency.
Discover how Showdigs can optimize your leasing operations and improve your portfolio's bottom line.

.gif)
.png)