

For large-scale property management companies, calculating rental income isn’t just about top-line numbers; it's about understanding true asset performance. The calculation starts with your Gross Potential Income (GPI). From there, you subtract losses from vacancy and credit, then deduct all operational expenditures. What's left is your Net Operating Income (NOI)—the single most important metric for evaluating a property's financial health before debt service.
Why Nailing Your Income Calculation Matters at Scale
When you’re managing hundreds or even thousands of doors, a minor error in rental income calculation doesn't just add up—it compounds across the entire portfolio. It’s the bedrock of your valuation models, operational budgets, and growth strategy.
Inaccurate calculations can mask costly operational inefficiencies, leading to misallocated capital and a slow erosion of profitability, door by door. For any property management company focused on scaling, a standardized, data-driven approach to income calculation is mission-critical for optimizing cost-per-door and maximizing portfolio value.
Key Takeaway: At scale, small miscalculations multiply into significant financial drags. A standardized process for calculating income is critical for identifying underperforming assets, optimizing operational spend, and driving the highest possible return from every property.
The Foundation of Portfolio Health
Think of accurate income calculations as the core diagnostic for your business. With reliable data, you can confidently track the KPIs that drive enterprise value, like Gross Rental Yield and Capitalization (Cap) Rate. These aren't just spreadsheet figures; they inform high-stakes decisions on acquisitions, dispositions, and capital improvements.
If you want to dig deeper, running a regular business health check with leasing metrics is a game-changer for long-term growth.
A great starting point is gross rental yield, which compares your annual rent against a property’s market value. National averages provide a baseline, but for large-scale operators, portfolio performance is dictated by local market dynamics. A yield of 8% in a high-growth Sun Belt market versus 4.5% in a coastal city requires entirely different operational strategies and return expectations.
Managing this data across a multi-market portfolio is impossible without the right technology. This is where leveraging the best property management apps becomes essential. The right PropTech stack automates data aggregation and provides real-time dashboards, transforming complex financial data into actionable intelligence for smarter, more profitable decisions.
From Gross Potential Income to Reality: The Cost of Vacancy
Before you can determine what your portfolio is actually earning, you need a baseline: your Gross Potential Income (GPI).
GPI represents the maximum theoretical revenue your portfolio could generate if every unit were occupied and paying full market rent, 100% of the time. It’s the ceiling—your portfolio’s top-line earning power. While theoretical, it’s a crucial benchmark for measuring performance.
The most significant factor eroding GPI is vacancy. Every day a unit sits empty is a direct revenue loss. This is where operational metrics like Days on Market (DOM) become critical financial KPIs. The national average vacancy rate hovers around 6.6% as of early 2025, meaning a typical unit is empty for roughly 24 days a year. For a portfolio of 1,000 units, that's 24,000 vacant days annually—a massive drain on revenue that directly impacts your NOI.
This chart illustrates how much rental yields can differ by market, which directly impacts your income potential and vacancy loss projections.
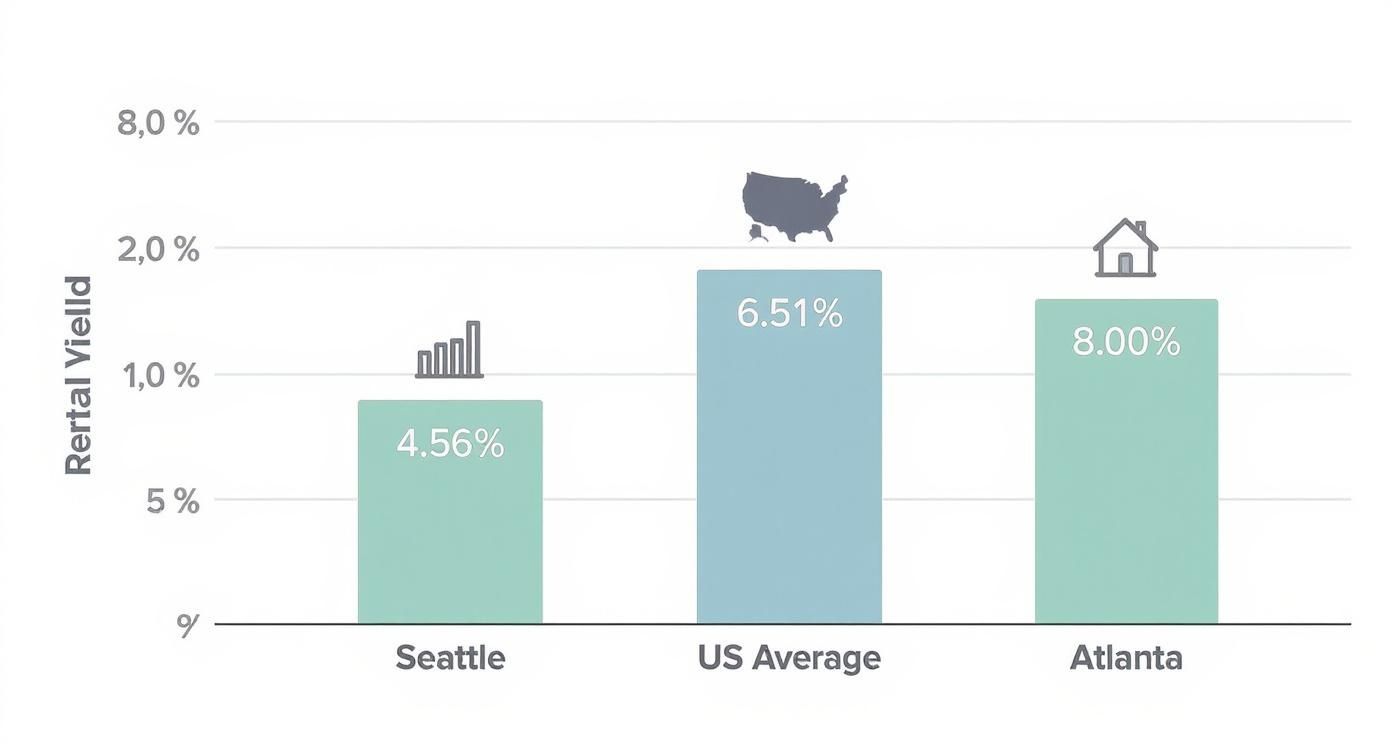
As you can see, geographic location plays a massive role in financial performance. Using a national average is insufficient for serious portfolio analysis; market-specific data is required.
To grasp the scale, let's analyze how vacancy impacts a 1,000-unit portfolio with an average rent of $1,500 per month.
Vacancy Cost Impact Analysis (1,000-Unit Portfolio Example)
Vacancy RateDays on Market (Approx. Annual)Annual Lost RevenueRevenue Gained per 1% Reduction8.0%29 Days$1,440,000$180,0006.6% (Nat'l Avg)24 Days$1,188,000$180,0005.0%18 Days$900,000$180,0003.0%11 Days$540,000$180,000
The financial implications are staggering. At the national average, this portfolio bleeds nearly $1.2 million in vacancy loss annually. Reducing that rate by just one percentage point—shaving about 3-4 days off the average DOM—recaptures $180,000 in pure revenue.
This is why speed-to-lease isn't just an operational goal; it’s a core financial strategy for any large-scale property manager. The faster you convert qualified leads into signed leases, the closer you get to your Gross Potential Income. To see how operational efficiency directly boosts revenue, explore our guide on how showing availability impacts vacancy rates.
Systemizing Operating Expenses for Portfolio Analysis
To get from gross to net income, you must rigorously track your Operating Expenses (OpEx). For property management companies managing distributed portfolios, a simple expense list is inadequate. You need a standardized, systemized approach to categorization, enabling true portfolio-wide analysis to identify opportunities for cost-per-door optimization.

The first step is sorting every expense into one of two buckets. This immediately clarifies your cost structure and highlights areas for efficiency gains.
Fixed vs. Variable Costs
Fixed Costs are the predictable, recurring expenses that remain consistent regardless of occupancy. Think of these as the baseline cost of ownership.
- Property Taxes: Annual assessments from local governing bodies.
- Insurance Premiums: Coverage for liability, property damage, and other risks.
- HOA or Condo Fees: Non-negotiable fees for properties within managed communities.
Variable Costs fluctuate based on occupancy, usage, and unforeseen maintenance issues. This is where operational excellence and technology can make the biggest financial impact.
- Repairs and Maintenance: From routine turns to emergency calls.
- Utilities: Costs for common areas and vacant units.
- Marketing and Leasing Costs: Spend on ILS listings, photography, agent commissions, and showing solutions.
Key Takeaway: A critical KPI for enterprise-level operators is cost-per-door. Tracking this metric for both fixed and variable expenses allows you to benchmark assets against each other and market averages. It quickly reveals which properties are underperforming and dragging down portfolio profitability.
Attempting this manually across a large portfolio is inefficient and prone to error. Modern PropTech platforms are essential, integrating with your core accounting systems to automate transaction categorization and provide real-time dashboards. This data-driven approach shifts your team from reactive financial clean-up to proactive budgeting and forecasting, turning expense data into actionable intelligence.
Calculating Net Operating Income: Your Ultimate Metric
After systemizing all operational costs, you can calculate the most important metric for portfolio valuation: Net Operating Income (NOI). This is the ultimate measure of an asset's profitability, as it strips away financing details like mortgage payments and capital expenditures.
NOI provides a pure, unfiltered view of a property's operational performance. It enables true apples-to-apples comparisons across your entire portfolio, regardless of how individual assets are financed. The formula is simple, but its strategic power is immense.
The NOI Formula in Action
The calculation is a straightforward subtraction:
Net Operating Income (NOI) = Effective Gross Income - Total Operating Expenses
To see this in a real-world context, let's walk through an example for a 500-unit portfolio. This calculation ties together all the income and expense line items into one clear financial summary, demonstrating how a mid-sized portfolio's performance is measured.
Sample NOI Calculation for a 500-Unit Portfolio
Here’s a step-by-step breakdown of the NOI calculation for this portfolio, moving from top-line potential revenue down to the final operating income.
Line ItemCalculation/NotesAmountGross Potential Income500 units x $1,800/mo avg rent x 12$10,800,000Less: Vacancy/Credit LossAssumed at a 7% rate($756,000)Effective Gross IncomeGross Income - Vacancy$10,044,000Less: Operating Expenses- Property Taxes$2,000 per door annually($1,000,000)- Insurance$500 per door annually($250,000)- Repairs & Maintenance8% of EGI($803,520)- Utilities (Common Area)$300 per door annually($150,000)- Management Fees4% of EGI($401,760)Total Operating Expenses($2,605,280)Net Operating Income (NOI)EGI - Total OpEx$7,438,720
This final NOI of $7,438,720 is far more than just a number. It is the engine that drives your property's valuation and your ability to secure favorable financing.
From NOI to Cap Rate
Your NOI is the key input for calculating the Capitalization Rate (Cap Rate), a critical metric for determining an asset's market value and its potential return on investment.
The formula is: Cap Rate = Net Operating Income / Current Market Value
A firm grasp on your NOI allows you to work backward to determine current asset values or forward to project future cash flow. This empowers portfolio managers to shift from simply reporting on past performance to actively forecasting and making data-backed decisions on acquisitions, dispositions, and capital improvements.
Forecasting Rental Income With Market Data
Calculating your current rental income provides a snapshot of today. Forecasting where that income is headed is how you build a real strategic advantage. For property management companies managing multi-market portfolios, projecting growth requires looking beyond internal data and analyzing the broader economic and demographic trends that shape rental demand.
Understanding market-level indicators like local housing supply, interest rate shifts, and renter demographic changes is essential for predicting your future pricing power and revenue. Layering this macroeconomic data onto your own portfolio's performance data allows you to build sophisticated financial models that anticipate market shifts rather than just reacting to them.
Building Market-Specific Forecasts
A national average provides context, but actionable forecasting must be market-specific. Build a framework to track key indicators for each region where you operate.
- Local Job Growth: A primary driver of new household formation and rental demand.
- Housing Supply Pipeline: Monitor new construction permits to understand future inventory levels.
- Demographic Shifts: Track population migration patterns and evolving renter preferences.
Beyond raw data, a strong command of strategic budgeting and forecasting transforms these insights into an actionable financial plan—one that can justify capital expenditures and help set aggressive but achievable revenue targets.
This forward-looking approach helps you get ahead of market shifts. For example, observing a slowdown in new construction alongside steady job growth in a specific market allows you to confidently project stronger rent growth for that segment of your portfolio.
This proactive analysis is supported by global trends. The global real estate rental market is projected to grow from $2.91 trillion in 2025 to $3.87 trillion by 2029, at a compound annual growth rate of 7.4%. This growth underscores the increasing importance of rental housing amidst ongoing urbanization and homeownership affordability challenges. You can review the full research on these real estate rental market trends to get the bigger picture.
By blending this high-level data with your on-the-ground operational insights, you create a powerful forecasting engine. To ensure your local rent comps are accurate, you can learn how to use Zillow to validate your rent with our guide.
FAQs for Enterprise Portfolio Managers
Even the most experienced portfolio managers face complexities when calculating rental income, especially across diverse, multi-market assets. Nailing the details isn't just about accurate bookkeeping; it’s about ensuring your financial reporting is robust enough to guide your next major strategic move.
NOI vs. Cash Flow: What’s the Real Difference?
The distinction is critical for investors and operators. Your Net Operating Income (NOI) is the purest measure of a property's operational profitability. It shows how much income an asset generates before factoring in debt service (mortgage payments) or capital expenditures.
Cash Flow, on the other hand, is the actual cash remaining after all expenses, including debt service and capital improvements, have been paid.
Think of it this way: NOI is used to compare the operational efficiency of different properties on an apples-to-apples basis. Cash Flow determines the actual cash distribution to investors.
How Should Non-Rental Income Be Treated?
Where do ancillary revenue streams like laundry, parking, pet fees, or storage fit in?
All non-rental operating income should be added to your Gross Potential Rent. This creates a more comprehensive metric called Total Potential Income, which represents the true maximum earning capacity of a property before accounting for vacancy and operating expenses.
For any large-scale portfolio manager, it's a best practice to recalculate NOI on a monthly and quarterly basis. This cadence allows you to stay ahead of performance trends and identify potential issues long before they become significant problems.
Ready to slash vacancy days and boost your NOI? Showdigs combines on-demand showing agents with intelligent automation to get your properties leased faster. See how our platform can reduce your Days on Market.