


At its core, the formula for rental yield is straightforward: divide the annual rental income by the property's total value, then multiply by 100. For large-scale property management companies, however, this simple percentage is one of the most powerful tools in your arsenal for judging asset performance and operational efficiency across thousands of units.
Why Rental Yield Is a Core KPI for Large Portfolios

When you're managing hundreds or even thousands of units, rental yield stops being just a simple calculation. It becomes a critical Key Performance Indicator (KPI) that tells the story of your portfolio's health. It’s the metric that guides everything from acquisition strategy to deciding which assets to divest.
Why is it so essential for enterprise-scale operations? Because it provides a standardized benchmark to compare performance across a diverse, multi-market portfolio.
Consistent yield tracking is like an early warning system. It allows operations directors to spot underperforming assets fast. If you see a declining yield in a specific market or building type, it could signal deeper operational issues—like rising Days on Market (DOM), inefficient lead-to-tour conversion, or bloated maintenance spending—long before they spiral out of control.
By turning rent and expenses into a clear percentage, rental yield gives you a powerful way to communicate performance. It translates complex operational data into a simple, compelling story for stakeholders and investors, proving the ROI of your management strategy.
Connecting Yield to Operational Efficiency
For large-scale operators, the real power of rental yield is how directly it connects to the operational metrics that define your success, like Days on Market (DOM) and cost per door. A high DOM, for instance, isn't just an operational headache; every day a unit is vacant is lost revenue that actively erodes your annual rental income, dragging down your net yield and damaging overall portfolio profitability.
Let's look at a basic example. A property purchased for $300,000 that brings in $18,000 in annual rent has a gross yield of 6%. That initial number is a good starting point, but it doesn't account for the real-world costs of running a property at scale, like management fees, vacancy losses, or turnover costs. To get a fuller picture, you can find great resources on rent and yield analysis from industry experts like Savills.
This is where understanding both gross and net yield becomes fundamental for any serious portfolio analysis.
To make this crystal clear, here’s a quick breakdown of how these two metrics differ and what they tell you.
Gross vs Net Rental Yield At a Glance
Mastering both calculations is non-negotiable for scaling your operations effectively.
Gross Yield: Think of this as your quick-glance metric. It gives you a high-level, top-line view of a property's potential to generate income relative to its price. It’s incredibly useful for making fast comparisons when you're scouting for new properties to acquire.
Net Yield: This is where the rubber meets the road. By factoring in all your operational costs—especially vacancy loss tied to DOM—net yield shows you the true profitability of an asset. It is the ultimate measure of your team's efficiency in controlling expenses and maximizing revenue.
When your operations team masters how to calculate and interpret rental yield at scale, you gain the data-driven insights needed to justify technology investments (like showing automation), fine-tune your leasing workflows, and ultimately drive higher returns across your entire portfolio.
Calculating Gross Rental Yield Across Your Portfolio
Sure, the basic gross rental yield formula seems straightforward. But when you're managing a large-scale, multi-market portfolio, things get complicated fast. For operations directors and portfolio managers, the real challenge isn't just crunching a single number. It's about creating a standardized metric that lets you make true, apples-to-apples comparisons across thousands of doors.
The core formula doesn't change:
Gross Rental Yield = (Annual Rental Income / Property Value) x 100
The trick to scaling this calculation is to establish crystal-clear, consistent definitions for each variable. If you don't, your yield data will become inconsistent and unreliable, making it useless for any real strategic decisions.
Standardizing Property Value
The first and biggest hurdle is defining "Property Value" for your entire portfolio. To get meaningful enterprise-level reports, you have to pick one method and stick with it universally.
- Purchase Price: This is the simplest and most static metric. It’s fantastic for tracking how an asset has performed since the day you acquired it, providing a consistent baseline for ROI calculations.
- Current Market Value (CMV): This is a much more dynamic figure that reflects what the property is worth right now. While it gives you a more accurate snapshot of current performance, calculating it regularly across thousands of units can be a massive resource drain and introduce variability.
For most large-scale operators, using the original purchase price is the most effective approach. It provides the most consistent baseline for tracking long-term ROI and performance against acquisition goals. Save CMV calculations for strategic decisions like refinancing or disposition.
Aggregating Annual Rental Income
Next up, you need a smart way to pull together your "Annual Rental Income" data. Your property management software (PMS) is your single source of truth here. Any enterprise-grade system should let you run reports that add up the total rent collected for each property over a 12-month period, which can be integrated with other platforms via API.
One crucial tip: make sure the report pulls actual collected rent, not just the potential or scheduled rent. This simple step gives you a much more realistic gross yield by factoring in vacancies or any concessions you offered, tying directly to leasing performance.
The real power of gross yield in a multi-market portfolio comes from segmentation. A portfolio-wide average is nice, but the magic happens when you break it down by market, asset class, or even the age of the building. That’s where you uncover the critical performance trends a single number would completely hide.
Let's walk through a real-world scenario to see how this plays out for an enterprise property manager.
Imagine you're managing a 5,000-unit portfolio spread across three very different markets: a high-growth urban center, a stable suburban area, and a smaller, up-and-coming market.
First, you’d export the annual rental income for all 5,000 units straight from your PMS. Then, you match each unit's income to its standardized property value (let's use the purchase price).
From there, you can calculate the gross yield for every single property. But don't stop there. The final, most important step is to segment those results by market.
By doing this, you might discover that your urban properties have a lower gross yield of 5% because of their sky-high acquisition costs. Meanwhile, your suburban assets are pulling a solid 7%, and your emerging market properties are leading the pack at 8.5%. This is the kind of baseline data you need to pinpoint which markets are actually driving performance and where a few operational tweaks—like reducing DOM—could make the biggest revenue impact.
Measuring True Profitability with Net Rental Yield
Gross yield gives you a quick, high-level snapshot, but for an operations director, it’s dangerously incomplete. If you want to understand the true financial health of a property—and by extension, your entire portfolio—you have to dig deeper and calculate the net rental yield. This is where your skill as a large-scale property manager is really put to the test.
Net yield cuts through the optimistic top-line number and shows you the actual cash a property is generating after all operating expenses are paid. For those of us overseeing hundreds or thousands of units, this is the metric that actually matters for budgeting, performance reviews, and strategic planning. A high gross yield can easily hide an unprofitable property that's secretly bleeding cash from excessive vacancy or maintenance costs.
The formula for net rental yield builds on the gross calculation, but adds a crucial layer:
Net Rental Yield = ( (Annual Rental Income - Annual Operating Expenses) / Property Value ) x 100
This image breaks down the basic idea of how rent and property value come together to create a yield percentage.
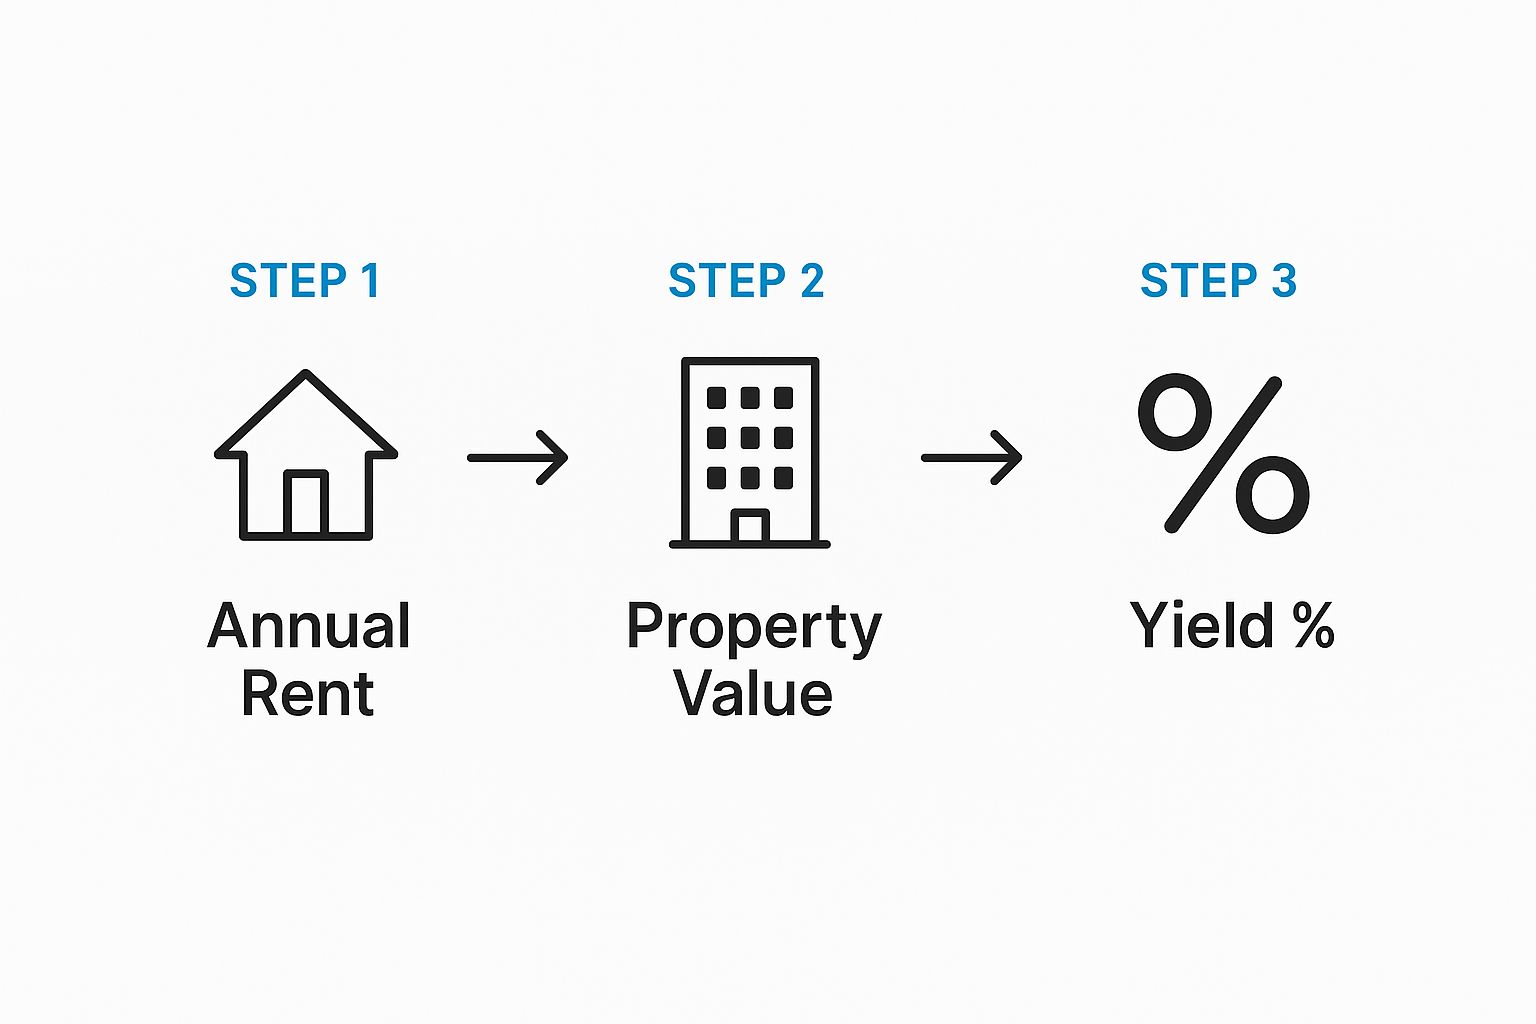
While the image shows the core concept, the real work in getting an accurate net yield is in the "Annual Operating Expenses" part.
Accounting for Every Operational Cost
The critical difference here is meticulously tracking your "Annual Operating Expenses." It's a classic mistake to overlook or underestimate these costs, which leads to a dangerously inflated sense of profitability. For a true net yield calculation, your expense list needs to be airtight and standardized across your portfolio.
Your checklist should include, at a minimum:
- Property Taxes: A significant and unavoidable annual cost.
- Insurance: This covers both property and liability insurance premiums.
- Routine Maintenance & Repairs: Everything from minor plumbing fixes to larger system upkeep. Don't forget this.
- Property Management Fees: The cost of your own team's services or any third-party management you use.
- HOA Dues: If applicable, these recurring fees must be factored into your calculations.
- Vacancy Loss: The most critical variable cost, directly tied to leasing efficiency.
- Capital Expenditures (CapEx) Fund: You absolutely must be setting aside funds for major replacements like roofs, HVAC systems, or water heaters.
For enterprise-scale portfolios, the two most critical—and often miscalculated—expenses are vacancy costs and maintenance. Getting these right across thousands of units is essential for accurate net yield reporting and measuring the ROI of your leasing operations.
Calculating Vacancy and Maintenance at Scale
Vacancy isn't just about lost rent; it's a direct reflection of your leasing team's efficiency and lead-to-tour conversion effectiveness. Instead of just plugging in a generic 5% vacancy rate, you should tie this cost directly to your operational metrics. A much sharper way to calculate this is by using your average Days on Market (DOM). This connects your leasing performance directly to the bottom line.
Likewise, maintenance costs need to be normalized. Sure, one unit might have zero repairs in a year while another needs a new water heater, but you can smooth this out. The best practice is to calculate an average maintenance cost per door across your entire portfolio. This approach prevents one-off outliers from skewing the net yield of a single property and gives you a much more stable, predictable expense figure for your calculations.
By meticulously tracking these real-world costs, you move from a speculative gross yield to a net yield that tells the true story of your assets and the effectiveness of your remote management systems. It’s this granular focus that separates the good portfolio managers from the great ones.
Benchmarking Portfolio Performance Across Markets

Calculating your portfolio's net yield is a great first step, but the number is meaningless on its own. A “good” rental yield isn’t a magic number; it’s a moving target that changes drastically from one city to the next. For property managers with units spread across different markets, a single, one-size-fits-all yield goal is more than just impractical—it’s a surefire way to misjudge how your assets are actually performing.
The real secret to managing a portfolio at scale is to benchmark performance accurately within each market. Every city has its own unique yield environment, shaped by things like the local economy, population trends, property types (like SFR vs. multifamily without onsite management), and housing inventory.
A 5% net yield that seems just average in a hot, high-appreciation market like Austin could actually be a massive win. Meanwhile, an 8% yield in a stable Midwest city might just be hitting the baseline expectation. It’s all about context.
Setting Realistic Market-Specific Targets
If you're managing a multi-market portfolio, the first thing to do is ditch the idea of a single, portfolio-wide yield target. You need to create specific yield goals for each segment of your portfolio. This granular view lets you fairly assess the performance of your local teams and the true health of your assets.
Here’s a scalable implementation framework:
- Segment Your Portfolio: Group your properties by metropolitan statistical area (MSA) or even down to the submarket level.
- Analyze Local Comps: Dig in and find out what comparable properties are yielding in that specific area using industry data.
- Set Tiered Goals: Based on that research, establish realistic, unique yield goals for each market segment.
When you do this, your yield calculation transforms from a simple pass/fail metric into a powerful diagnostic tool. It shines a light on which markets are truly outperforming and where you might need to step in with a new strategy to reduce DOM or improve lead conversion. This data is also gold when you're talking to investors, as it helps explain why a lower yield in a high-growth market is a smart long-term play.
How Location Dictates Yield Expectations
Global trends show just how massive this performance gap can be. According to recent data from Savills, prime rental rates in major world cities have seen significant growth. Cities with strong migration and super low vacancies, like New York and Los Angeles, saw yields climb above 4.5%.
On the flip side, many hubs in the Asia-Pacific region were reporting yields closer to 2.0%. This just goes to show how much local conditions drive returns. You can dive deeper into the Savills research on how global city rental yields vary based on economic conditions.
A lower-than-average yield in one market isn't always a red flag. It might signal a strategic investment in a high-appreciation area where long-term value growth is the primary goal, not immediate cash flow.
At the end of the day, putting your numbers into context is what really matters. It helps you make smarter decisions about when to enter or exit a market and where to focus your efforts for the biggest impact.
Once you understand these nuances, you can explore targeted, market-aware strategies in our guide on 8 ways to boost ROI. Your goal isn't just to hit an arbitrary number—it's to make sure every single asset in your portfolio is beating its direct competition.
Boosting Net Yield Through Operational Efficiency
Once you have a solid handle on calculating your net rental yield, the real work begins. This is where top-tier property managers separate themselves from the pack: by actively improving that number. For anyone managing a large portfolio, boosting profitability isn’t about guesswork. It’s about making smart, data-backed changes to your remote operations.
The game really comes down to two things: increasing your rental income and aggressively cutting your operational costs. While you can always explore income-boosting tactics like smart unit upgrades, the fastest path to a healthier bottom line is by optimizing your operations. This is where your team’s day-to-day performance turns into measurable financial gains, especially when scaled across thousands of units.
Slash Vacancy Costs by Reducing DOM
Days on Market (or DOM) is the silent killer of net yield. Every single day a unit sits empty, it's not just failing to earn you money—it's actively costing you. That's why the single most powerful way to boost your net yield is to shrink the time it takes to get from lead to lease.
For a portfolio of 1,000 units with an average rent of $2,000/month, cutting your average DOM from 21 days to just 14 saves 7,000 vacant days per year. This translates to over $460,000 in recovered revenue annually, adding it directly back to your bottom line and instantly lifting your net yield. This is the power of speed-to-lease.
This is where on-demand showing technology like Showdigs becomes a complete game-changer for remote management. By automating how tours are scheduled and tapping into a network of field agents, you can offer same-day showings. You end up converting those high-intent leads before they go cold and look elsewhere. This operational shift is a direct assault on vacancy costs, which are a major drag on your net yield. Learning how to maximize passive income on your rental property almost always starts with minimizing how long it sits empty.
Drive Down Costs Through Scalable Systems
Vacancy isn't the only expense you can tackle. Other operational costs can be systematically chipped away to improve your profitability.
- Outsourced Maintenance: Instead of managing a costly in-house team or juggling a messy list of local vendors, using a centralized, on-demand maintenance service can lower your average cost per repair. It also dramatically simplifies the administrative headache that comes with managing dispersed portfolios.
- Centralized Admin: Think about all the back-office work like lead qualification and follow-up. Consolidating these tasks with technology frees up your property managers to focus on high-value activities like owner relations and strategic growth. You can further improve efficiency by streamlining rental operations with AI assistants that handle all the routine, repetitive inquiries.
So, what does this look like in the real world? Let's break down how these changes might impact the net yield of a typical rental asset.
Here's a look at how seemingly small operational tweaks can directly boost the net yield on a standard investment property.
Impact of Operational Changes on Net Yield (Example $350k Property)
As the table shows, these efficiencies add up quickly. A +0.25% net yield increase might not sound like much on one property, but apply that across a portfolio of 1,000 similar homes, and you're suddenly looking at an $845,000 boost to the portfolio's net operating income. It's all driven by leveraging technology to work smarter, not just harder.
Answering Your Rental Yield Questions
Even with the formulas down pat, applying rental yield calculations across a big, scattered portfolio is where things get tricky. For operations directors and portfolio managers, the real expertise lies in the nuance of how you apply these numbers.
Let's dig into some of the most common questions that pop up. Moving from theory to practice is what ensures every team member understands how this core metric shapes their daily decisions and, ultimately, the portfolio's bottom line.
How Often Should I Calculate Yield for a Large Portfolio?
For large-scale operations, a quarterly calculation of both gross and net yield is the gold standard.
Why? It’s the sweet spot. This frequency is just right for spotting emerging trends and flagging underperforming assets before they become a major drag on your finances. It also gives you enough time to measure the impact of recent operational changes, like a new leasing strategy you rolled out to slash your Days on Market (DOM).
Daily calculations are just not practical, and monthly figures can get thrown off by big, one-off expenses. A quarterly review gives you a stable, actionable dataset. Of course, an annual roll-up is still crucial for high-level strategy and keeping your investors happy.
What Is a Good Rental Yield for a Multi-Market Portfolio?
This is the million-dollar question, but the answer is: there's no single "good" number. It all comes down to location, location, location.
For example, a 5% net yield might be fantastic in a hot, high-appreciation market like San Francisco, where a huge chunk of your return comes from the property's value skyrocketing. But that same 5% could be a serious red flag in a Midwest market where 8% is the norm and cash flow is king.
The biggest mistake multi-market operators make is chasing a single, portfolio-wide target. Stop doing that. Instead, benchmark each market segment of your portfolio against its specific local competition. That contextual analysis gives you a much truer picture of performance and the ROI of your remote operations.
Global data really drives this point home. While the United States has an average gross rental yield of around 6.68%, other countries see wildly different returns. The UAE leads with yields near 12.3%, while many developed markets hover around 4%. It all underscores the importance of local context, as you can see in this deep dive into global rental returns.
How Do I Account for Vacancy Costs Accurately?
Using a generic vacancy percentage—like plugging in a standard 5%—is one of the most common and costly mistakes for large portfolios. It completely masks the financial impact of your leasing team's efficiency (or inefficiency) and obscures the true cost of a slow leasing cycle.
A much sharper method is to calculate your actual vacancy cost using your own operational data.
Here’s the formula: (Average Days on Market / 365) x Annual Potential Rent
This calculation creates a direct, measurable link between your team's ability to fill units fast and your financial results. It makes DOM a non-negotiable part of your net yield analysis and shows everyone in the organization just how critical speed-to-lease really is for portfolio-wide profitability. To explore other key KPIs and strategies, check out the insights on the Showdigs property management blog.
Ready to shrink your Days on Market and boost your net yield across your entire portfolio? Showdigs provides the AI-backed leasing automation and on-demand showing agents you need to convert leads faster and turn vacancies into revenue. Discover how Showdigs can optimize your operations at scale.

.png)
.png)