

For property managers juggling hundreds or even thousands of units, the vacancy rate is so much more than just another number on a spreadsheet. It’s a direct pulse on your portfolio's financial health and operational efficiency. Getting this calculation right is the critical first step in spotting expensive problems—like a slow lead-to-lease funnel or uncompetitive pricing—before they silently eat away at your bottom line.
Why Vacancy Rate Is More Than Just a Number

In large-scale property management, your vacancy rate tells a story about everything from your leasing team's performance to your marketing ROI. This single KPI is absolutely non-negotiable, especially for operations directors managing scattered single-family rentals (SFRs) and multifamily properties that don't have on-site staff. It’s the primary lever you can pull to shrink your Days on Market (DOM) and improve your overall cost-per-door.
A Diagnostic Tool for Remote Operations
When your properties are spread across different markets, you can't just "walk the property" to see how things are going. The vacancy rate becomes your eyes and ears on the ground, flagging potential issues.
Even a slight uptick can be a warning sign. It might point to:
- A bottleneck in your showing process: Are qualified leads getting stuck waiting too long for a tour, impacting your lead-to-tour conversion?
- Ineffective marketing spend: Are your listings actually reaching the right people in a specific sub-market?
- Pricing misalignment: Have your rental rates fallen out of sync with what the local market will bear, causing qualified leads to drop off?
Without tracking your vacancy rate precisely and consistently, these problems can fester for weeks, leading to a significant loss of revenue.
The Foundation of Financial Health
At the end of the day, every single day a property sits empty is money lost. It's that simple. The accuracy of your vacancy calculation influences everything from financial forecasting to making strategic investment decisions. Residential rental vacancy rates can swing quite a bit, reflecting economic shifts and population trends. In fact, data tracked by the Federal Reserve Economic Data (FRED) from Q1 1986 through Q1 2024 shows just how much this metric can fluctuate, helping investors and managers understand market tightness and adjust their strategies.
For an enterprise portfolio, a 1% increase in vacancy isn't just a number—it represents potentially hundreds of thousands of dollars in lost annual revenue. It's a critical alert that demands immediate operational investigation.
The Two Critical Vacancy Rate Formulas You Should Use
Alright, let's get into the numbers that actually matter. To get a real grip on your portfolio's performance, you have to look beyond just one generic vacancy percentage. There are two key ways to calculate vacancy, and each one tells a different, crucial part of the story for anyone managing a large portfolio.
Unit-Based (Physical) Vacancy Rate
First up is the most common one: the unit-based or physical vacancy rate. This is your quick snapshot of how many doors are empty. It’s a solid, high-level metric for things like gauging your leasing team's workload or just getting a baseline count of empty properties.
The formula couldn't be simpler:
Vacancy Rate = (Number of Vacant Units / Total Number of Units) x 100
So, if you're managing a portfolio of 1,500 homes and 75 of them are sitting empty, your calculation is (75 / 1,500) x 100. That gives you a 5% physical vacancy rate. It's useful, but it can also be a bit deceptive because it treats a $1,200/month starter home and a $4,000/month luxury rental as equal. They're not.
Revenue-Based (Economic) Vacancy Rate
This is where the real insight comes in, especially if you're driven by KPIs. The revenue-based or economic vacancy rate cuts through the noise and measures the actual financial damage of your empty units. Instead of counting doors, it counts the dollars you're losing. This is non-negotiable when you’re managing properties spread across different markets with a wide range of rent prices.
The formula shifts the focus to what you could be earning:
Economic Vacancy Rate = (Lost Rent from Vacant Units / Gross Potential Rent) x 100
Let's go back to that same 1,500-unit portfolio. Say its total potential monthly rent—if every single unit were occupied—is $2,500,000. Now, what if those 75 vacant units just happen to be your higher-end properties? Their combined lost rent might be something like $175,000.
Suddenly, the math looks very different: ($175,000 / $2,500,000) x 100. Your economic vacancy rate is actually 7%.
That's a huge difference. A 5% physical vacancy rate might seem acceptable, but a 7% economic vacancy rate tells you that you're bleeding cash from your most valuable assets. This is the number that should drive your leasing priorities and financial forecasting. It’s in that gap between physical and economic vacancy where you either protect your profit margins or watch them disappear.
Comparing Unit-Based vs. Economic Vacancy Rate Formulas
Seeing these two formulas side-by-side really clarifies when and why to use each one. Both are essential, but they serve very different purposes in your operational toolkit.
Ultimately, relying on just one of these metrics gives you an incomplete picture. The physical rate tells you about operational capacity, while the economic rate reveals the true financial impact. A KPI-driven operator uses both to make informed decisions that directly impact revenue.
This infographic shows how vacancy rates can differ significantly across various property types in the commercial sector.
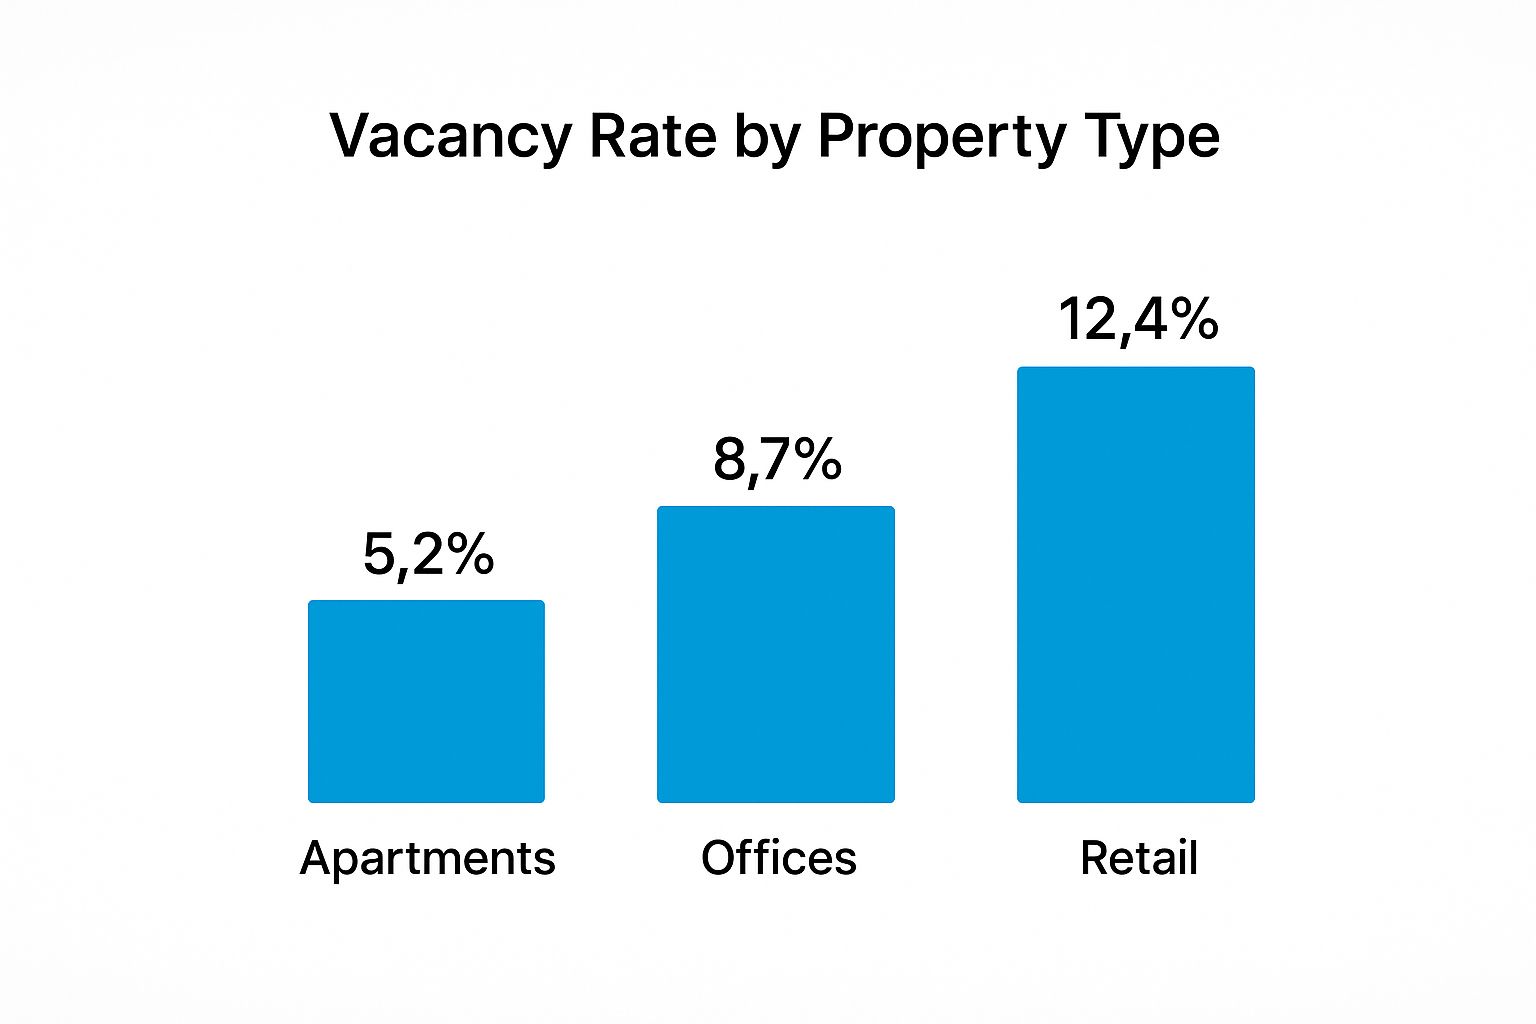
As you can see, what's considered a "normal" vacancy rate can swing wildly depending on the asset. It’s another reminder to always drill down into the specifics of your own properties and markets instead of relying on broad industry averages.
How to Keep Your Vacancy Data Clean at Scale

Let's be honest: your vacancy rate is only as reliable as the data you put into it. For those of us managing hundreds or thousands of doors across different markets, bad data isn't just a nuisance—it's a direct hit to the bottom line. It masks problems, pushes back revenue, and makes optimizing your portfolio a complete guessing game.
The real challenge is getting everyone and every system on the same page. When your leasing platform and your Property Management System (PMS) are telling you different stories, you get discrepancies that hide the true vacancy picture. This is where revenue quietly leaks out of your business.
A single unit marked "rent-ready" when it's really stuck in the make-ready process doesn't just throw off your numbers. It creates a terrible experience for prospects and wastes your leasing team's time chasing a ghost.
Standardize Your Key Data Points
To get a true read on vacancy, your entire team and tech stack need to speak the same language. Small internal mix-ups can skew your data just as much as major market shifts. We all saw how the job vacancy rate in the Euro area dropped by 0.5 percentage points during the 2020 pandemic—a perfect example of how sensitive these metrics are to big events. Your job is to eliminate the internal static so you can react to those external changes effectively.
Start by getting crystal clear on these definitions across your entire operation:
- Total Rentable Units: This is the absolute, final count of every property in your portfolio that can generate income. No exceptions.
- Vacant Rent-Ready Units: This needs a strict definition. It means a unit is 100% ready for a tenant to move in today. It’s passed the final inspection, and you have the keys ready to hand over.
- Cumulative Vacant Days: The total number of days all your empty units have been sitting vacant over a specific period. This is the only way to calculate the true cost of your Days on Market (DOM).
When your tech and your teams are aligned on what these terms mean, you build a solid foundation for your vacancy rate calculation. This accuracy is the first step toward finding operational bottlenecks and discovering powerful ways to lease your properties quicker and cheaper.
Turning Vacancy Rate Data Into Actionable Insights

Knowing your vacancy rate is a great start. But the real magic happens when you use that number to make smarter decisions, especially when you're managing hundreds or even thousands of properties. This is where top-tier operators pull away from the pack—they turn a simple percentage into a concrete action plan.
The secret? It's all about context. You need to benchmark your rate against the local market, sure, but the most powerful comparison is against your own historical data. That's how you spot trends before they become problems.
A rising vacancy rate isn't just a number on a spreadsheet. For a large portfolio, it’s a bright red flag waving from your lead-to-lease funnel. It might signal a lag in following up with leads, but more often than not, the culprit is a bottleneck in your tour scheduling. Every hour a great prospect has to wait for a tour is another hour they have to find—and sign—a lease with someone else.
Case Study: Diagnosing a Scheduling Bottleneck
Let's look at a real-world scenario. A 2,000-unit operator managing a scattered single-family portfolio saw their economic vacancy rate creep up by 1.5% in a single quarter. That might not sound like much, but it translated to over $40,000 in lost rent every single month.
Instead of just shrugging and blaming the market, they dove into their operational data. What they found was a huge delay: their average time from a lead’s first inquiry to a completed tour was nearly 72 hours. In that time, their best leads were going cold and moving on.
Pulling these kinds of actionable insights from your vacancy data is a key part of a comprehensive financial analysis and should guide both your investments and day-to-day operations. Once they identified the lag, they implemented an on-demand showing solution to get prospects through the door the same day.
The Fix and Financial Recovery
The results were almost immediate. The operator slashed their average lead-to-tour time from 72 hours to under 12 hours. This one simple fix, all prompted by a deep dive into their vacancy rate, led to some incredible wins:
- Their average Days on Market (DOM) dropped by 8 days.
- They recovered nearly all of that lost monthly rent by the next quarter.
- Their lead-to-lease conversion rate saw a major boost.
This is a perfect example of connecting a high-level metric like vacancy rate to a specific, fixable process on the ground. It proves that even small operational delays can have a massive financial impact at scale. Understanding how showing availability impacts vacancy rate is non-negotiable for any property manager serious about maximizing revenue.
That 1.5% increase wasn't just a statistic; it was a clear signal to fix a broken process.
Advanced Vacancy Analysis for KPI-Driven Operators
For property management companies serious about growth, a single, portfolio-wide vacancy rate just doesn't cut it. It’s a vanity metric. To really move the needle on performance and revenue, you have to dig deeper. Advanced analysis is all about segmenting your vacancy data to catch weak spots before they drag down your bottom line.
A high vacancy rate is almost never a simple, uniform problem. Is the issue concentrated in one specific neighborhood? Is a particular asset class, like your single-family homes, lagging behind your small multifamily buildings? When you start breaking down the data, you uncover the real story.
Moving beyond a portfolio-wide number is essential. A healthy 5% overall vacancy rate might be masking a critical 12% vacancy in a high-value market or with a specific unit type, silently eroding your profits.
Building a Portfolio Health Dashboard
The goal here is to get out of reactive, fire-fighting mode and into a proactive, data-driven strategy. This means creating a simple "portfolio health dashboard" that shows you segmented metrics at a glance, so you can take smart, decisive action.
You can start by tracking vacancy rates broken down by:
- Geographic Market: How are your properties in City A performing compared to City B?
- Property Type: Are SFRs and duplexes performing differently?
- Unit Size: Are your 2-bedroom units flying off the market while the 3-bedrooms sit empty?
- Leasing Agent Performance: See which agents are closing leases and who might need a bit more support.
This level of detail lets you deploy targeted, surgical solutions instead of just guessing. For example, you might discover that one city needs more aggressive apartment leasing incentives to fill vacancies, while another simply needs a slight price adjustment on its larger units.
Thinking this way isn't new; it mirrors how economists look at the bigger picture. They analyze the relationship between job vacancy and unemployment to see how healthy a labor market is. Some countries have high vacancy but low unemployment, which points to an efficient market. Others show the opposite, signaling bigger problems. You can learn more about how economists use vacancy rates to spot these kinds of underlying trends.
By applying that same segmented approach to your own portfolio, you turn raw data from a reporting headache into your most powerful tool for making strategic decisions.
Got Questions About Vacancy Rates? We've Got Answers.
Even the sharpest property managers run into questions when digging into the finer points of vacancy rates. When you're managing a large portfolio, getting the details right is what separates the good from the great. Here are a few common questions we see pop up all the time.
What's a "Good" Vacancy Rate for a Big Portfolio?
Everyone loves to throw around the industry benchmark of 4-6%, but the truth is, a "good" vacancy rate is all about context. It's deeply tied to your specific market, the types of properties you manage, and even the time of year.
For operators at scale, the most powerful metric isn’t a single number. It’s the trend—how your vacancy rate is moving over time compared to your direct local competition.
A vacancy rate that's creeping up, even if it's still technically "good" by national standards, is a red flag. It’s an early warning of an operational issue that needs your attention now, before it turns into a major revenue leak.
How Often Should We Be Looking at Our Vacancy Rate?
For portfolios managing hundreds or thousands of doors, things move fast. A monthly report is ancient history by the time it hits your desk.
Your approach should be multi-layered:
- Track it in real-time. Your property management dashboard should give you a live look at vacancy. No excuses.
- Review it weekly. Your operations and leasing teams need to huddle up every week to formally review the numbers.
- Analyze it monthly and quarterly. This is for the high-level strategy, like budgeting and forecasting for the next quarter.
Those weekly check-ins are where the magic happens. It’s your best chance to catch and fix a negative trend, especially if you see Days on Market (DOM) starting to climb for your available units.
Do Units in Make-Ready Count as Vacant?
Yes. 100%. From a purely financial perspective, if a unit isn't making you money, it's vacant. It doesn't matter if it's being painted or is pristine and ready to go. If you can't sign a lease on it today, it's hurting your bottom line.
But for smarter operations, you have to break this down further. You need to track two different kinds of vacancy:
- Rent-Ready Vacancy: These are the units available for immediate move-in. If this number is high, you have a leasing or marketing problem on your hands.
- Turnover Vacancy: These units are stuck in the make-ready pipeline. A high number here means you've got a bottleneck with your turnover team or your vendors.
Splitting your data this way gives you a crystal-clear diagnosis. You'll know instantly whether to put pressure on your leasing team to close deals or on your maintenance crew to speed up turns. It’s all about sending your resources to fix the right problem.
By asking these deeper questions, your vacancy rate transforms from a simple KPI into a powerful diagnostic tool. Ready to slash your Days on Market and get properties filled faster? Showdigs uses AI-backed leasing automation and a network of on-demand agents to get qualified tenants touring your properties the same day they inquire, drastically cutting down on lost rent.