If you’re just getting started in real estate, a standard rental property ROI calculator is a decent tool to get a basic feel for a property's potential. But once you're managing a serious portfolio of 100, 1,000, or even 10,000+ units, those simple calculators just don't cut it. They give you a quick snapshot, but they completely miss the bigger, more complex picture that drives a large-scale operation.
For an operations director focused on cost per door, scalability, and revenue impact, a basic calculator is fundamentally flawed. It ignores the very metrics that make or break your profitability at scale: Days on Market (DOM), lead-to-tour conversion rates, and speed-to-lease. It treats each property like an island, completely disconnected from the interconnected system that is your actual operation.
Why Standard ROI Calculators Fail at Scale

When you’re overseeing a portfolio of 100, 1,000, or even 10,000+ units, you know that success is about so much more than the purchase price and monthly rent of one property. Your reality is infinitely more complex. Those online ROI calculators are built for the individual investor, not for the operations director who lives and breathes portfolio-wide efficiency and KPI-driven results.
The fundamental flaw in these basic tools is that they ignore the operational metrics that directly impact revenue. They can't answer the critical questions for a large-scale manager: How much revenue is a 45% DOM reduction worth across 5,000 units? What's the financial impact of improving our lead-to-tour conversion by 5%?
The Disconnect Between Basic Formulas and Operational Reality
The global rental property market is a massive $5.35 trillion industry. In such a competitive arena, large-scale operators have to use more than just a simple calculator to steer their strategy. To truly understand what’s driving returns in today's market, you need a far more robust tool—one that accounts for the dynamic, real-world inputs that basic calculators miss.
A simple cash-on-cash return formula won't tell you how operational drag is eating into your bottom line. It can't quantify the financial bleeding caused by an extra week of vacancy spread across hundreds of units or a small dip in your lead-to-tour conversion rate.
Key Takeaway: For enterprise-level property management, a rental property ROI calculator must be more than a financial formula. It needs to be an operational diagnostic tool that connects daily activities like showings and lead management directly to long-term profitability and revenue recovery.
Metrics That Basic Calculators Ignore
Standard calculators get stuck on a few basic inputs, leaving out the key performance indicators (KPIs) that are absolutely critical when you're managing a large, distributed portfolio.
Here are just a few of the metrics they miss:
- Portfolio-Wide Vacancy Loss: They might calculate the vacancy for a single unit, but they can't show you the cumulative revenue drain across your entire portfolio from slow leasing velocity.
- Cost Per Door: They don't factor in the true operational overhead—marketing, showings, maintenance, tech stack—required to manage each and every unit at scale.
- Speed-to-Lease: This is a huge one. The time it takes to get a qualified lead to sign a lease has a massive, direct impact on revenue, yet it's completely absent from basic ROI models.
- Lead-to-Tour Conversion Rates: This is a vital sign for the health of your leasing funnel. Low conversion rates mean high lead costs and longer vacancy periods, directly impacting your bottom line.
To highlight just how different the data needs are, let's compare the inputs for a standard calculator versus one built for an enterprise portfolio.
As you can see, the enterprise-level metrics are all about operational efficiency and speed.
Ultimately, if a calculator can't model the financial impact of reducing your average Days on Market (DOM) by 10% or show you the ROI of improving tour conversion rates, it simply wasn't built for the challenges of modern, large-scale property management. You don't just need a historical snapshot; you need a predictive model.
Gathering Your Essential Portfolio-Level Data

Any good rental property roi calculator is only as good as the numbers you put into it. That sounds obvious, but when you're managing a large portfolio, it's easy to miss the mark. To get a real, actionable picture of your financial performance, you have to move beyond just plugging in the purchase price and monthly rent. We need to look at standardized data that reflects the messy reality of managing hundreds or even thousands of units across multiple markets.
The whole point is to create a repeatable data collection process that works across your entire portfolio. This starts by pulling information straight from your Property Management Software (PMS) and accounting systems. Consistency is everything here. Every single data point needs to be defined and tracked the same way for every property, or your final ROI calculation will be more fiction than fact.
Differentiating Potential from Actual Revenue
First things first, we have to separate the theoretical from the actual. It’s crucial to track both your Gross Potential Rent (GPR) and what you actually collect.
- Gross Potential Rent (GPR): This is your best-case scenario. It’s the total rent you'd bring in if every unit was occupied and every single resident paid their rent on time, every time.
- Actual Collections: This is the cash that really lands in your bank account after you account for vacancies, late payments, delinquencies, and any concessions you've offered.
That gap between GPR and actual collections? That's where you can see how well your operations are really running. A big difference is a red flag, telling you it’s time to dig into why units are sitting empty or why collections are lagging. For large portfolios, this gap is where millions in revenue are lost or gained.
A classic mistake is basing ROI forecasts only on GPR. It paints an unrealistically rosy picture and completely hides major drags on your profitability, like a high Days on Market (DOM) that’s quietly eating away at your bottom line.
Itemizing Your True Operational Expenses
Next, you absolutely have to break down your operational expenses on a cost per door basis. This is the only way to accurately compare efficiency at scale and pinpoint where you might be bleeding money. Your PMS should be able to generate these reports for you.
Your list of essential expenses should include:
- Property Management: Think of all the overhead tied to managing the portfolio. This includes software subscriptions (your tech stack), your staff's salaries, and other administrative costs.
- Marketing & Leasing: This is your total spend on advertising and lead generation, but don't forget the critical component: your showing costs. This could be fees you pay to agents or the cost of using a platform like Showdigs to handle on-demand tours and reduce DOM.
- Repairs & Maintenance: You’ll want to look at the average cost for both routine and emergency maintenance across the whole portfolio.
- Capital Expenditures (CapEx): You can't forget to budget for the big-ticket items down the road—roofs, HVAC systems, and appliances. A standard approach is to set aside a specific amount per unit, per year, into a CapEx reserve fund.
While gathering this data, remember to account for the long-term responsibilities of major appliances. For more on that, check out this guide on what landlords need to know about white goods. By standardizing how you collect all this information, you're building a solid foundation for a rental property ROI calculator that gives you a true health check on your entire portfolio.
Calculating the Core Metrics for Portfolio Management

Once you've got accurate, portfolio-level data in hand, it’s time to do the math. For enterprise property managers, a true rental property ROI calculator isn't about finding one simple number. It's about getting a multi-faceted view of performance that tells you different things about your cash flow, asset value, and long-term wealth generation.
Let’s break down the three core metrics that really matter when you're managing at scale.
Cash-on-Cash Return for Leveraged Portfolios
Think of Cash-on-Cash Return as the ultimate gut-check for your initial investment. It answers a simple but critical question: "For every dollar I put in, how much am I getting back each year?" This is especially vital for leveraged portfolios, where your initial cash outlay is just a fraction of the total asset value.
The formula is pretty straightforward:
Cash-on-Cash Return = Annual Pre-Tax Cash Flow / Total Cash Invested
- Annual Pre-Tax Cash Flow: This is your gross rental income minus all your operating expenses and your annual debt service (i.e., your mortgage payments).
- Total Cash Invested: This number bundles together the down payments for all properties, closing costs, and any cash you spent on initial renovations or make-ready work.
This metric is your go-to for seeing how efficiently your cash is working for you. Keep in mind, though, it doesn't factor in property appreciation or the equity you're building by paying down your loan—both of which are huge parts of your total return.
Capitalization Rate for Asset Comparison
The Capitalization (Cap) Rate is your tool for comparing apples to apples. It measures a property's potential return as if you bought it with cash, completely removing financing from the equation. That makes it invaluable for comparing properties across different markets or sizing up a new acquisition without getting bogged down by different loan terms.
Here’s the formula:
Cap Rate = Net Operating Income (NOI) / Current Market Value
- Net Operating Income (NOI): This is all your rental income minus operating expenses—before you account for mortgage payments.
You can't get an accurate Cap Rate without first knowing how to properly calculate rental income and making sure every penny is accounted for. Generally, a higher cap rate suggests higher potential returns (and often, higher risk), while a lower cap rate points to lower risk and a more stable, mature asset.
For portfolio managers, tracking the average cap rate of your holdings against market benchmarks is a powerful way to gauge whether your assets are performing as they should be.
Total Return on Investment for a Complete Picture
This is the big one. The most holistic metric of them all. Total ROI pulls everything together: cash flow, the equity you've built by paying down loans, and any property appreciation. It gives you the full, unvarnished story of your investment’s performance over time.
While a typical rental property ROI might hover between 8% and 12%, this number can swing wildly based on market dynamics. For example, a 2024 analysis by Moody's Analytics highlighted that multifamily rents are expected to see a noticeable uptick, impacting overall returns significantly for large-scale operators.
By looking at all three of these metrics, you get a strategic, 360-degree view of your portfolio's health. You can see how operational tweaks impact your cash flow, how your assets stack up against the market, and how your long-term wealth is actually growing.
For even more ideas, check out our guide on 8 ways to boost your rental property ROI.
Connecting Operational KPIs to Your Financial Forecast
A truly powerful rental property ROI calculator doesn't just look backward; it connects the dots between your day-to-day operations and your future financial performance. For enterprise property managers, this is where the magic happens. You're translating operational metrics, or KPIs, into predictable financial forecasts. This transforms your ROI model from a static report card into an active guide for your entire business.
The two most impactful metrics to bridge this gap are Days on Market (DOM) and lead-to-tour conversion rates. These aren't just abstract leasing stats; they are direct inputs into your revenue engine. Every extra day a unit sits empty, or every qualified lead that doesn't end up touring, represents a real financial loss—one that gets multiplied across your entire portfolio.
The True Cost of Vacancy at Scale
For a small landlord, a single vacant day is a minor headache. But when you’re managing hundreds or even thousands of units, those individual days compound into a massive drain on revenue. Fully grasping this impact is the key to justifying any investment in making your operations more efficient.
Let’s put some real numbers to it. The formula to calculate portfolio-wide vacancy loss is surprisingly simple but incredibly revealing:
Vacancy Loss = (Average Daily Rent per Unit) x (Average DOM) x (Number of Annual Turnovers)
Imagine you run a 1,000-unit portfolio. The average rent is $1,800/month, which breaks down to $60/day. If your average unit sits vacant for 28 days (DOM) and you turn over 40% of your units each year (400 turnovers), the math looks like this:
$60/day x 28 DOM x 400 turnovers = $672,000 in annual vacancy loss
That number should make you sit up and take notice. It’s the real, tangible cost of your current leasing velocity.
This simple infographic illustrates how everything flows from initial cash flow analysis all the way to hitting your target return.
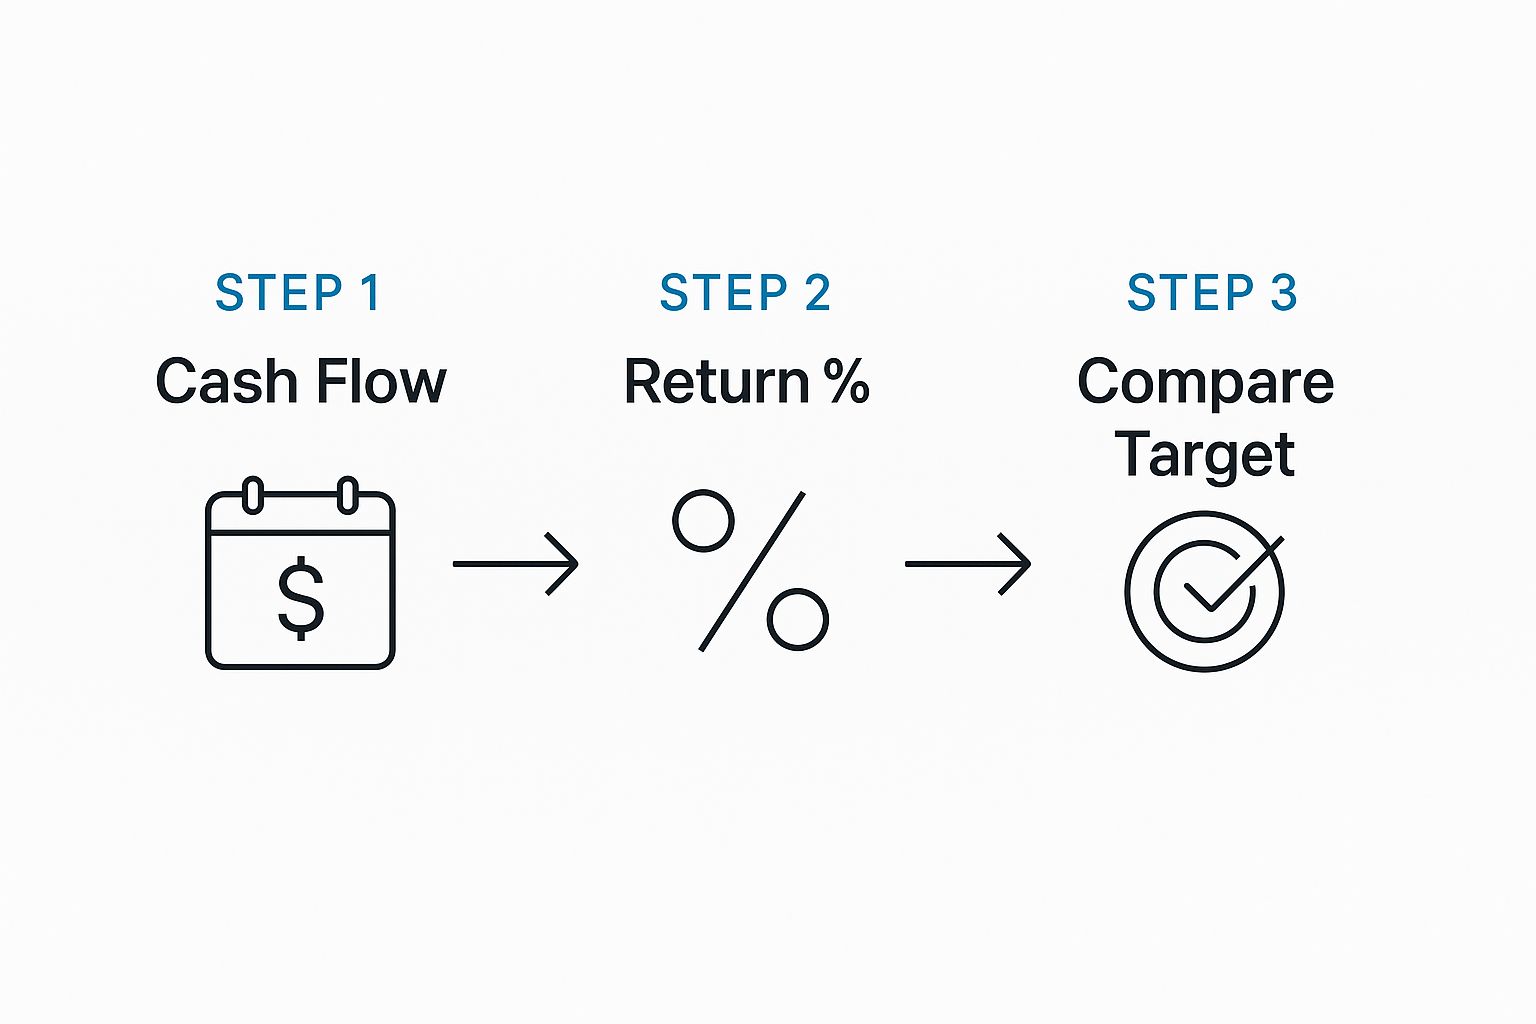
As the visual shows, reaching your target ROI is the final goal. But getting there is entirely dependent on maximizing your cash flow, which is directly hammered by how fast (or slow) your operations are.
Modeling the ROI of Operational Improvements
Now for the exciting part. Let’s see how tweaking just one operational KPI can have a direct, positive impact on your bottom line.
Mini Case Study: A 5,000-unit property management company was struggling with a 32-day average DOM, leading to significant revenue leakage. By implementing an on-demand showing solution, they enabled same-day tours, drastically increasing their lead-to-tour conversion rate. Their average DOM dropped by 40% to just 19 days.
Let’s model the ROI of a similar improvement. What if you could adopt a new technology, like the on-demand showing network, and cut your average DOM from 28 days down to 25 days—a reduction of 3 days? It might not sound like much, but let’s plug it back into our formula for a 1,000-unit portfolio.
- Savings per Turnover: 3 days x $60/day = $180
- Total Annual Savings: $180 x 400 turnovers = $72,000
That’s $72,000 in recovered revenue flowing directly back into your Net Operating Income (NOI). All from one small operational improvement in leasing speed.
This is exactly how you build a business case. By connecting a metric like DOM reduction to a hard dollar amount, your rental property ROI calculator becomes a strategic tool. It allows you to prove the value of investing in platforms that accelerate your leasing speed and model the financial upside of operational changes before you even spend a dime.
Framework for a Scalable ROI Dashboard
Alright, let’s talk about moving beyond that manual spreadsheet you've been wrestling with. When you're managing hundreds or even thousands of units, a static, error-prone spreadsheet isn’t a strategic asset—it’s an operational bottleneck. The real goal is to build an automated, scalable rental property roi calculator, or more accurately, a dynamic dashboard that gives you real-time insights without the soul-crushing burden of manual data entry.
Making this leap isn't just about getting new software; it's about shifting your mindset to be more tech-forward and scalable. It transforms your ROI calculation from a historical document into a living, breathing tool that helps you make smarter decisions every single day.
A Phased Approach to Automation
I've seen companies rush this process, and it almost always ends badly. You get inaccurate data and a fancy new tool that nobody on your team trusts. To do it right, you need a structured, phased approach.
- Phase 1: Standardize Your Data Inputs: Before you dream of automation, you have to enforce ruthless consistency. This is the unglamorous but absolutely critical first step. Every single data point—from how you log a maintenance expense to how you define 'Days on Market'—must be identical across your entire PMS.
- Phase 2: Build the Master Calculator: Now, start building out your master calculator. I recommend doing this in a familiar tool like Google Sheets or Excel first. This is your sandbox to perfect all your formulas and logic, making sure you incorporate every portfolio-level metric we've discussed, especially DOM and lead conversion. This "master template" becomes the engine for your dashboard.
- Phase 3: Leverage API Integrations: This is where the magic happens. Use API integrations to automatically pull real-time data from your Property Management Software (like AppFolio or Yardi) and financial systems directly into that master calculator. This is what finally kills manual data entry, slashes human error, and keeps your numbers fresh.
- Phase 4: Visualize with BI Tools: The final step is to connect your data-rich spreadsheet to a Business Intelligence (BI) tool. Platforms like Tableau, Power BI, or even Google Looker Studio will transform all those rows of numbers into intuitive, visual dashboards. Suddenly, you can track portfolio performance against ROI goals at a glance.
Integrating Macro-Level Trends
A truly sophisticated ROI dashboard doesn't operate in a vacuum. It has to account for the bigger picture—the market forces that are constantly influencing your property values and returns. For instance, global real estate trends show a clear link between capital growth, rental income, and overall ROI. With rental growth often outpacing inflation, a dynamic dashboard needs to factor this in for any kind of realistic forecasting. To get a better handle on these dynamics, you can learn more about the global real estate market outlook.
Key Insight: The ultimate goal of a scalable ROI dashboard is to directly connect operational efficiency to your financial outcomes. When you see your portfolio’s ROI dip in real-time, you can immediately drill down and see if the problem is a spike in Days on Market in a specific city or a sudden drop in lead conversion rates.
This kind of system gives you the power to ask—and instantly answer—the most critical questions facing your business. It turns your data into a true strategic asset, helping you not only track performance but also model the financial impact of operational tweaks. To learn more about making those tweaks, check out our guide on how to lease your properties quicker.
Frequently Asked Questions
When you're managing a large portfolio, digging into ROI always brings up a few key questions. Here are some quick, real-world answers for operations directors and portfolio managers who are ready to move beyond basic spreadsheets and use a rental property ROI calculator as a serious strategic tool.
How Often Should I Recalculate Portfolio ROI?
For the big picture, a full, deep-dive ROI analysis should be on your calendar quarterly. This lines up perfectly with financial reporting and strategic planning sessions, giving you a solid benchmark of how the entire portfolio is performing.
But don't wait three months to check the pulse. Your operational KPIs—the numbers that really drive ROI—need constant attention. I'm talking about metrics like Days on Market (DOM), vacancy rates, and your cost per lease. These should be on an automated dashboard you can check weekly, if not daily. This lets you make quick, smart adjustments to keep things on track between those bigger quarterly reviews.
What Is a Good ROI for a Large Rental Portfolio?
You'll hear a lot of people throw around 8-12% cash-on-cash return as the gold standard, but for large portfolios, that’s just one piece of the puzzle. Honestly, a "good" ROI depends entirely on your strategy. Are you all in on maximizing immediate cash flow, or are you playing the long game with a focus on appreciation and growth?
Instead of getting hung up on one number, focus on your Total Return on Investment, which factors in property appreciation and the equity you're building through loan paydown.
Key takeaway: A truly strong ROI for a large portfolio is one that consistently beats market averages and is backed by solid, efficient operations. This means low DOM, high lead-to-tour conversion, and optimized cost per door.
For more deep dives into property investment and financial forecasting, the Fundpilot Blog is a great resource that many managers find useful.
How Can Technology Directly Improve My Portfolio ROI?
This is where things get exciting. Technology boosts your ROI by hitting both sides of the profit equation: it drives up revenue while slashing operational costs. Think about it: a showing automation platform like Showdigs directly attacks your Days on Market. By enabling same-day showings, you accelerate the leasing cycle. Fewer days vacant means less lost rent and more income in the bank. Simple as that.
On the other side, integrating your Property Management Software with other smart tools cuts down on tedious manual work and costly human errors. Every bit of friction you remove from your leasing and management process lowers your cost per door, which directly pumps up your Net Operating Income (NOI). The right tech stack isn’t a cost center; it’s an engine for turning operational wins into real financial gains. For more strategies on this, check out some other articles on the Showdigs blog.
Ready to connect your operational performance directly to your financial returns? Showdigs is the fastest path from lead to lease for distributed portfolios, proven to reduce DOM and optimize your lead-to-tour conversion rates. Learn how Showdigs can boost your portfolio's ROI.