

For large-scale property management companies, calculating the vacancy rate isn't just an accounting task—it's a critical diagnostic for operational efficiency and revenue health. The formula is simple: divide the total number of vacant days by the total potential rentable days, then multiply by 100. However, the insights derived from this single metric are profound.
This percentage is a direct reflection of your speed-to-lease and the effectiveness of your entire lead-to-tour pipeline. For operators managing hundreds or thousands of units, understanding how to calculate and act on the vacancy rate is the first step toward minimizing revenue leakage and maximizing portfolio performance.
The Foundational Metric for Portfolio Health
For property managers juggling geographically dispersed portfolios, the vacancy rate isn't just another number on a spreadsheet. It's the pulse of your entire operation. A single percentage point can represent tens or even hundreds of thousands of dollars in lost annual revenue.
This metric provides a clear, high-level view of how efficiently your leasing pipeline is converting leads and minimizing the costly downtime between tenants. A rising rate is the first warning sign of deeper operational issues—perhaps pricing is misaligned with the market, marketing channels are underperforming, or your lead-to-tour process is too slow. It’s a critical signal that your operations team needs to intervene with data-backed solutions.
This quick visual breaks down the process.
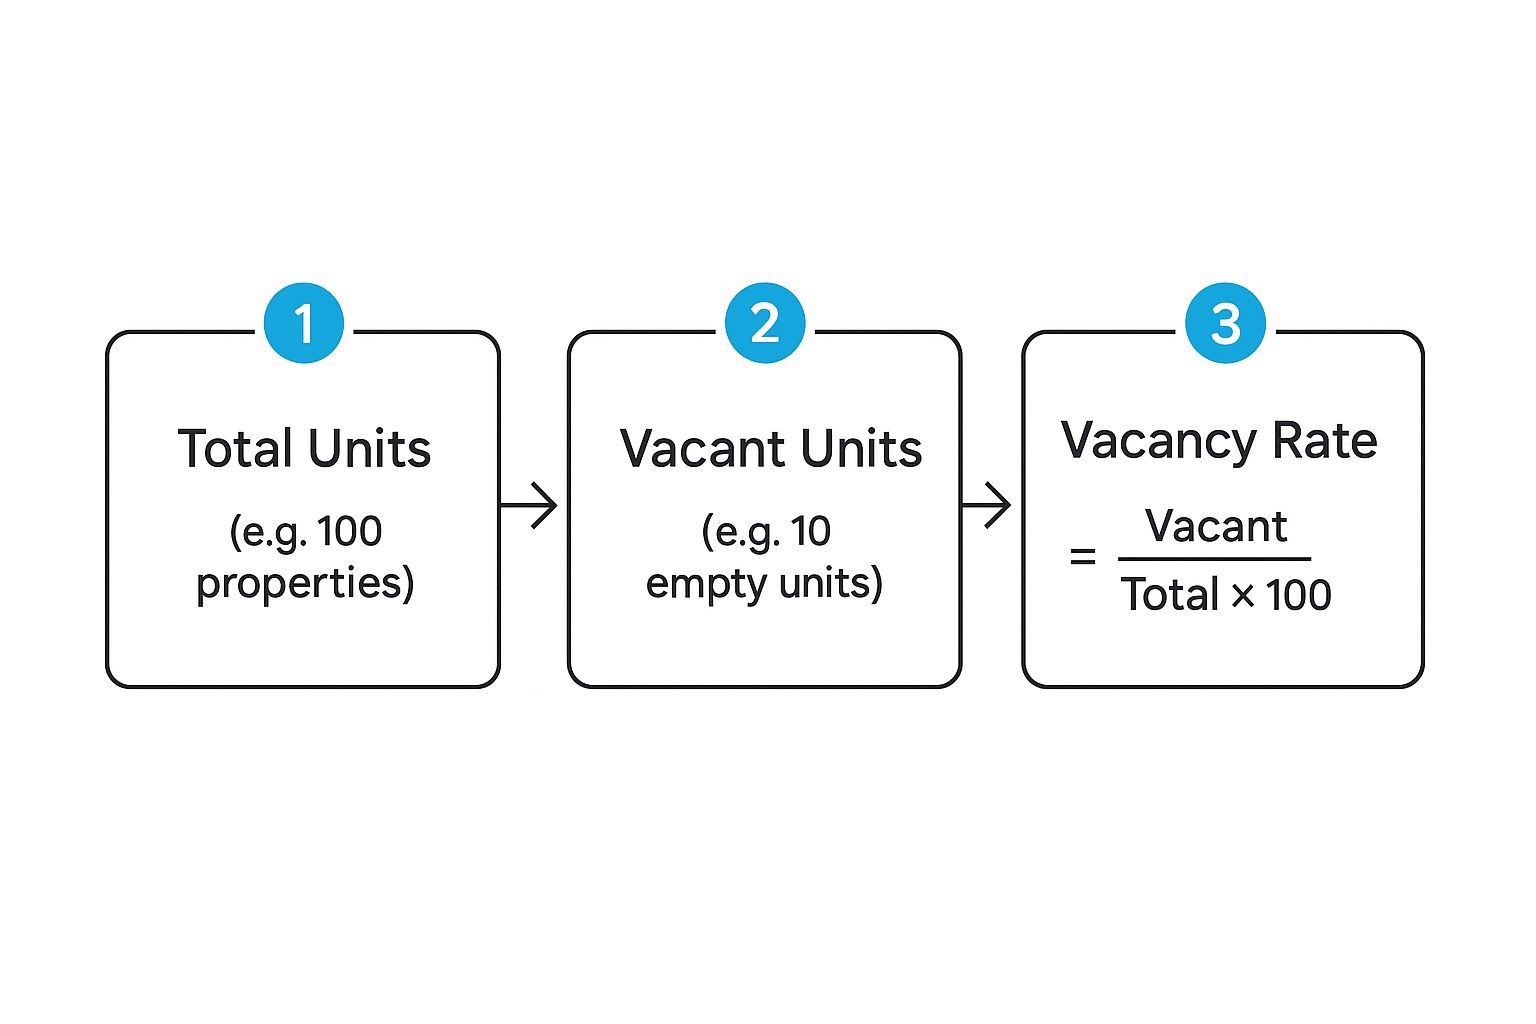
As you can see, it's a direct ratio of your empty, available units to your total inventory. It provides a clean snapshot of your occupancy status at any given time.
Defining Key Terms for Large-Scale Operations
To ensure your vacancy rate is accurate across a large and distributed portfolio, standardizing definitions across your team is non-negotiable. Consistent inputs are critical for reliable, actionable data.
Here’s a breakdown of the key components for an enterprise-level calculation.
Standardizing these definitions ensures everyone from regional managers to the C-suite is working from the same playbook, creating a reliable KPI to guide strategic decisions.
For an enterprise property manager, this isn't just a percentage—it's a direct measure of lost revenue. Every point in your vacancy rate represents tangible income leakage. This is why an obsessive focus on reducing Days on Market (DOM) and accelerating speed-to-lease is paramount.
Ultimately, how you manage your showings has a massive impact on keeping that vacancy rate low. You can learn more by exploring how showing availability impacts vacancy rate in our detailed guide.
Adapting Vacancy Calculations for Mixed-Asset Portfolios

Managing a mix of single-family rentals (SFRs) and multi-family units without onsite staff presents significant reporting challenges. Applying a one-size-fits-all approach to vacancy rate calculation can obscure crucial performance differences between asset classes, leading to flawed operational strategies.
To achieve a true apples-to-apples comparison across your portfolio, you must standardize your calculation methodology. While the core formula remains the same, the complexity of data aggregation increases with scale.
Calculating for a Single-Family Rental
Let’s start with a simple, real-world example. Say you have a single-family home that sat empty for 21 days last year. The math is straightforward.
- Vacant Days: 21
- Total Rentable Days: 365
- Vacancy Rate: (21 ÷ 365) x 100 = 5.75%
This is simple for one property, but manually tracking this across a portfolio of 500+ SFRs is untenable. This is precisely why centralized tracking within your property management software, integrated with your leasing systems, is non-negotiable for accurate portfolio-wide reporting.
Scaling Up to Multi-Family Buildings
Now, consider a 50-unit apartment building. With leases expiring at different times throughout the year, tracking individual unit vacancy days manually is a recipe for errors and operational drag. The only scalable approach is to analyze the property in aggregate.
The correct methodology is to sum the total vacant days for all units and divide by the total potential rentable days for the entire building.
For a triplex where Unit 1 had 0 vacant days, Unit 2 had 10, and Unit 3 had 31, you would sum the vacant days (41) and divide by the total rentable days for all three units (1,095). This provides a clear vacancy rate of 3.7% for the property. For more detailed examples, check out this guide on how to calculate vacancy rates for different property types.
Key Takeaway for Scaled Operations: For multi-family properties, always focus on aggregate performance. Calculating total vacant days across all units provides a much clearer picture of a building's health than getting lost in the weeds of dozens of individual unit rates.
By using this standardized approach, you can confidently compare the performance of a 50-unit building in one market against a portfolio of 50 SFRs in another. This is the quality of data required to make intelligent operational decisions at scale.
Economic vs. Physical Vacancy: What Top Operators Track
When scaling a property management business, you learn quickly that an empty unit is only part of the vacancy story. Relying solely on physical vacancy—the basic count of unoccupied properties—provides a dangerously incomplete view of your portfolio's financial health.
It tells you if a unit is empty, but it completely misses the revenue loss on units that are technically occupied.
This is where the most sophisticated operators shift their focus to economic vacancy. This metric is far more revealing, as it measures the gap between your portfolio’s Gross Potential Rent (GPR) and your actual collected revenue. It uncovers all forms of income loss, not just an empty property.
Uncovering Hidden Revenue Loss
Economic vacancy exposes the financial leaks that a simple physical vacancy count will always miss. Just because a unit has a resident doesn't mean it's a performing asset.
Consider these common scenarios that drive up your economic vacancy rate, even when a unit is physically occupied:
- Delinquent Tenants: A tenant who hasn't paid rent in two months makes a unit physically occupied but 100% economically vacant. It is generating zero income.
- Rent Concessions: That "one month free" offer on a 12-month lease directly creates an 8.3% economic vacancy for that unit's annual term.
- Below-Market Leases: Long-term tenants paying rates significantly under current market value contribute to economic vacancy. The delta between their rent and what a new lease would command is pure revenue loss.
Tracking economic vacancy is mandatory for understanding a portfolio's true financial performance. It uncovers the subtle but significant revenue drains that a physical vacancy count glosses over, giving you a brutally honest measure of your operational efficiency and leasing strategy.
By monitoring this deeper metric, you can pinpoint specific operational weaknesses. A high delinquency rate may indicate flaws in your tenant screening process, while heavy reliance on concessions could signal misaligned market pricing or a slow leasing process that necessitates incentives. This insight is critical for data-driven decisions that genuinely boost net operating income (NOI).
Turning Vacancy Data Into an Actionable Revenue Strategy

Knowing how to calculate your vacancy rate is table stakes. Using that data to drive revenue is where elite operators create a competitive advantage. For large portfolio managers, this metric is a powerful decision-making tool that should guide your entire leasing and marketing strategy.
By analyzing vacancy trends by market, asset type, and even floor plan, you can pinpoint underperforming assets, identify regional challenges, and uncover critical bottlenecks in your lead-to-lease pipeline.
The goal is to stop treating vacancy as a lagging indicator and start using it as a forward-looking guide to proactively slash Days on Market (DOM) and boost NOI.
From Data Points to Action Plans
Is the vacancy rate climbing for a specific property type or in a certain submarket? That’s a clear signal for intervention. Instead of guessing, let the data guide your response.
For example, high lead volume but low lead-to-tour conversion rates for a group of properties points directly to a bottleneck in your showing process. Prospects are interested, but are dropping off while waiting for an agent or due to restrictive tour availability. This insight allows you to focus on optimizing tour scheduling rather than wasting budget on more marketing.
Conversely, low lead volume but high conversion rates suggest a top-of-funnel marketing problem, not an issue with the properties or the showing experience.
An optimized leasing process is your best defense against high vacancy. Every friction point—from slow lead response to limited showing availability—directly contributes to higher DOM and lost revenue.
Here's a simple framework for translating vacancy data into a targeted action plan.
Action Plan Based on Vacancy Rate Trends
By systematically diagnosing the root cause behind your vacancy numbers, you can deploy targeted, effective strategies that directly address the problem. This is how you drive down DOM and truly maximize your portfolio's revenue potential.
Putting a Price Tag on Empty Units
Your vacancy rate is more than just a percentage; it’s a direct measure of lost revenue. Every day a unit sits empty, it actively erodes your bottom line. For property managers responsible for large portfolios, translating that percentage into a hard dollar figure is the most effective way to communicate the urgency of reducing Days on Market (DOM) to stakeholders.
This isn’t complex financial modeling. It's a straightforward calculation that quantifies operational inefficiency, making the problem impossible to ignore.
From Days to Dollars: The ROI of Speed-to-Lease
The formula is eye-opening in its simplicity: Total Vacant Days x Average Daily Rent = Total Vacancy Cost. This calculation immediately shifts the conversation from an abstract metric to a tangible financial impact.
Let’s run the numbers for a 1,000-unit portfolio where the average monthly rent is $1,800. This equates to an average daily rent of $60 per unit.
Now, if you’re operating at a 3% vacancy rate over a 30-day month, that means you have 30 empty units at any given time.
- Calculation: 30 units x 30 days = 900 total vacant days
- Vacancy Cost: 900 days x $60/day = $54,000 in lost revenue
This $54,000 is the monthly cost of vacancy for this portfolio. Annually, a 3% vacancy rate translates to over $648,000 in lost revenue. This is why a 1% improvement isn't a small win—it's a $216,000 annual gain.
When you can show your team or clients that reducing the average turnover time by just five days could recapture tens of thousands of dollars each month, investing in leasing optimization becomes a top priority. For a deeper dive, you can explore a detailed breakdown of how vacancy is calculated across different rental types on WallStreetPrep.com.
The Big Picture: Calculating the total cost of vacancy transforms an operational metric into a compelling financial argument. It precisely quantifies revenue leakage, providing clear motivation to invest in technology and processes that accelerate the lead-to-lease timeline.
Keep in mind, this number only accounts for lost rent. It doesn't include turnover costs like cleaning, repairs, and marketing spend. That's why understanding the importance of property condition reports is also critical for a complete picture of turnover expenses.
Get Ahead of Vacancies Before They Happen
The most profitable operators don't just react to vacancies; they build systems to preempt them. For large, distributed portfolios, this means abandoning a reactive mindset in favor of a proactive, data-driven approach to leasing. It’s about leveraging technology to anticipate churn and compress the downtime between tenants to its absolute minimum.
This proactive strategy hinges on monitoring leading indicators—the early warning signs—before they escalate into costly vacancies. Instead of waiting for a notice to vacate, top operators are analyzing their leasing funnel for signs of weakness.
Is your lead-to-tour conversion rate declining? This is a critical red flag. It could signal that your marketing is attracting unqualified leads, your pricing is misaligned, or your leasing process is creating too much friction for prospective tenants.
Centralize and Automate for Speed
Leveraging technology to automate tour scheduling and centralize leasing communications is a game-changer for remote operations. It eliminates the operational drag that causes qualified leads to go cold and sign a lease with a more responsive competitor.
When a prospective renter can book a showing instantly and have their questions answered in minutes, you dramatically shorten the timeline from initial interest to a submitted application.
Systemizing your leasing process is what sustainably keeps your vacancy rate low and your revenue high. Proactive management also includes efficiently handling worst-case scenarios, like using standardized eviction notice forms when necessary.
Key Insight: Proactive vacancy management is less about filling empty units and more about preventing them from staying empty for long. It's a tech-forward strategy that leverages data to predict market shifts and expose operational weaknesses, directly boosting your NOI.
Frequently Asked Questions About Vacancy Rates
Even for seasoned professionals, nuances in vacancy rate analysis can be challenging. Here are answers to common questions from managers of large-scale portfolios.
What Is a Good Vacancy Rate for a Large Rental Portfolio?
While a general industry benchmark is often cited as 5-8%, this figure is overly simplistic for sophisticated operators. The "right" rate is highly dependent on your specific market dynamics, asset class, and operational efficiency.
For tech-forward operators managing large portfolios, the primary goal is to consistently outperform the local market average. A rate below 5% is a strong indicator of high demand and a highly efficient leasing engine.
Conversely, a sustained vacancy rate above 10% demands immediate investigation into your pricing, marketing, and leasing pipeline. The key is to benchmark your performance against your own historical data and hyper-local market comps to set realistic, data-driven goals.
How Often Should I Calculate My Portfolio's Vacancy Rate?
For a large, dynamic portfolio, vacancy rate should be calculated and reviewed on a monthly basis. A less frequent cadence means you're operating with outdated information and will be slow to react to market shifts or operational issues.
A monthly review provides enough data to identify meaningful trends without being skewed by daily fluctuations. This frequency also ensures more accurate revenue forecasting and performance management.
Modern property management systems offer real-time dashboards, which are indispensable for operations directors who need a constant pulse on key performance indicators like vacancy, DOM, and lead-to-tour conversion rates.
How Does Vacancy Rate Relate to Days on Market?
Think of vacancy rate and Days on Market (DOM) as two sides of the same coin. DOM measures the speed (or lack thereof) of turning an individual unit, while the vacancy rate measures the cumulative financial impact of that speed across the entire portfolio.
A high average DOM is a direct cause of a high vacancy rate. Therefore, the most effective strategies to lower your vacancy rate are those that aggressively target DOM reduction, such as optimizing your lead-to-tour process, enabling same-day showings, and using dynamic pricing.
Ready to slash your DOM and shrink your vacancy rate? Showdigs is the first AI-backed leasing automation platform that cuts your lead-to-lease time by combining advanced software with a network of on-demand agents. Learn how we help enterprise-level property managers automate showings and sign leases faster at https://showdigs.com.
.png)